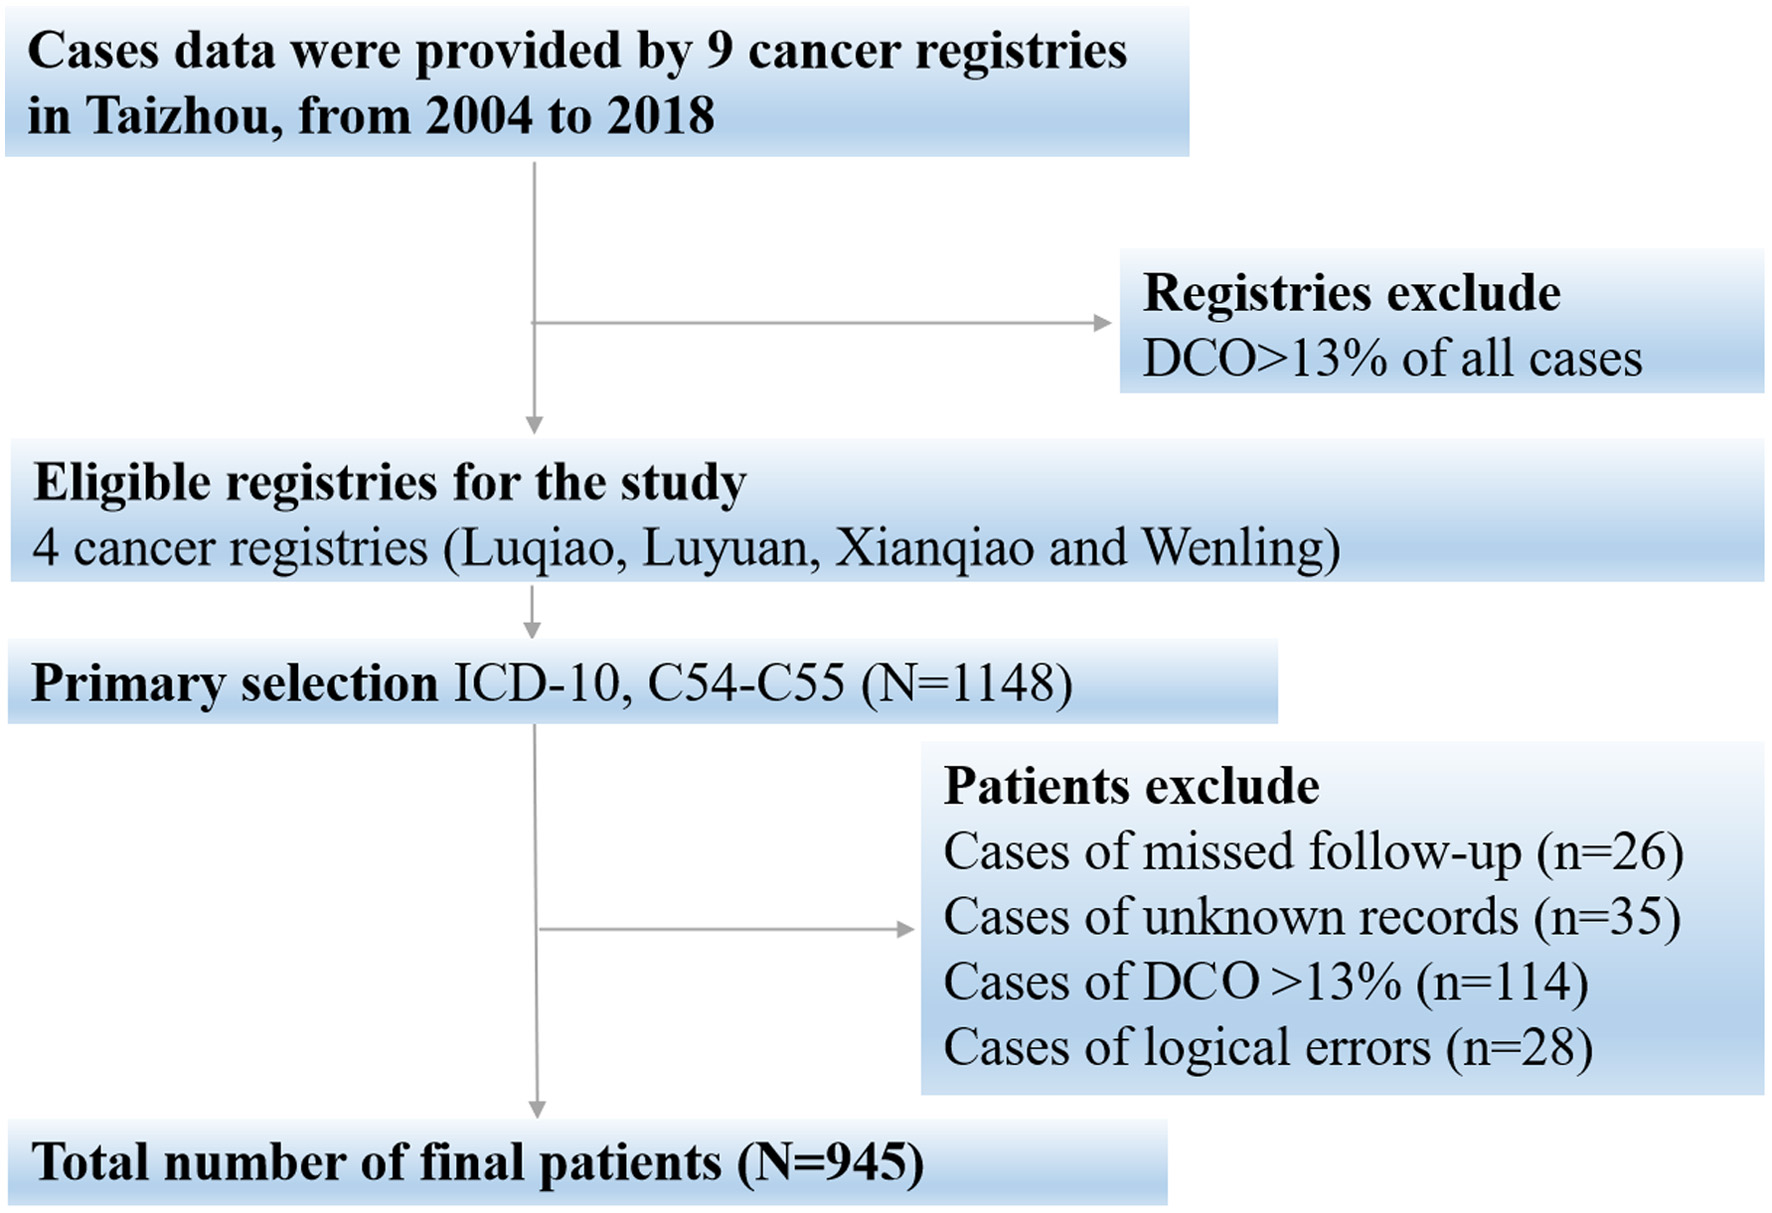
Figure 1. Flow chart for patient selection.
| World Journal of Oncology, ISSN 1920-4531 print, 1920-454X online, Open Access |
| Article copyright, the authors; Journal compilation copyright, World J Oncol and Elmer Press Inc |
| Journal website https://www.wjon.org |
Original Article
Volume 15, Number 5, October 2024, pages 784-791
Assessment of Five-Year Relative Survival of Patients With Endometrial Cancer: A Period Analysis
Figures
Tables
| Diagnosis | Follow-up year | ||||||||||||||
|---|---|---|---|---|---|---|---|---|---|---|---|---|---|---|---|
| 2004 | 2005 | 2006 | 2007 | 2008 | 2009 | 2010 | 2011 | 2012 | 2013 | 2014 | 2015 | 2016 | 2017 | 2018 | |
| The numbers within the cells indicate the years of follow-up since diagnosis. | |||||||||||||||
| 2001 | 3/4 | 4/5 | 5 | ||||||||||||
| 2002 | 2/3 | 3/4 | 4/5 | 5 | |||||||||||
| 2003 | 1/2 | 2/3 | 3/4 | 4/5 | 5 | ||||||||||
| 2004 | 1 | 1/2 | 2/3 | 3/4 | 4/5 | 5 | |||||||||
| 2005 | 1 | 1/2 | 2/3 | 3/4 | 4/5 | 5 | |||||||||
| 2006 | 1 | 1/2 | 2/3 | 3/4 | 4/5 | 5 | |||||||||
| 2007 | 1 | 1/2 | 2/3 | 3/4 | 4/5 | 5 | |||||||||
| 2008 | 1 | 1/2 | 2/3 | 3/4 | 4/5 | 5 | |||||||||
| 2009 | 1 | 1/2 | 2/3 | 3/4 | 4/5 | 5 | |||||||||
| 2010 | 1 | 1/2 | 2/3 | 3/4 | 4/5 | 5 | |||||||||
| 2011 | 1 | 1/2 | 2/3 | 3/4 | 4/5 | 5 | |||||||||
| 2012 | 1 | 1/2 | 2/3 | 3/4 | 4/5 | 5 | |||||||||
| 2013 | 1 | 1/2 | 2/3 | 3/4 | 4/5 | 5 | |||||||||
| 2014 | 1 | 1/2 | 2/3 | 3/4 | 4/5 | ||||||||||
| 2015 | 1 | 1/2 | 2/3 | 3/4 | |||||||||||
| 2016 | 1 | 1/2 | 2/3 | ||||||||||||
| 2017 | 1 | 1/2 | |||||||||||||
| 2018 | 1 | ||||||||||||||
| Characteristics | Number of cases (%) | Diagnosed interval | ||
|---|---|---|---|---|
| 2004 - 2008 (%) | 2009 - 2013 (%) | 2014 - 2018 (%) | ||
| Total | 945 (100) | 67 (100) | 389 (100) | 489 (100) |
| Region | ||||
| Urban area | 224 (23.7) | 27 (40.3) | 65 (16.7) | 132 (27.0) |
| Rural area | 721 (76.3) | 40 (59.7) | 324 (83.3) | 357 (73.0) |
| Average age (years) | 65.2 | 63.1 | 66.9 | 65.7 |
| Age at diagnosis (years) | ||||
| < 55 | 191 (20.2) | 7 (10.4) | 87 (22.4) | 97 (19.8) |
| 55 - 64 | 212 (22.4) | 12 (17.9) | 97 (24.9) | 103 (21.1) |
| 65 - 74 | 311 (32.9) | 28 (41.8) | 126 (32.4) | 157 (32.1) |
| > 74 | 231 (24.5) | 20 (29.9) | 79 (20.3) | 132 (27.0) |
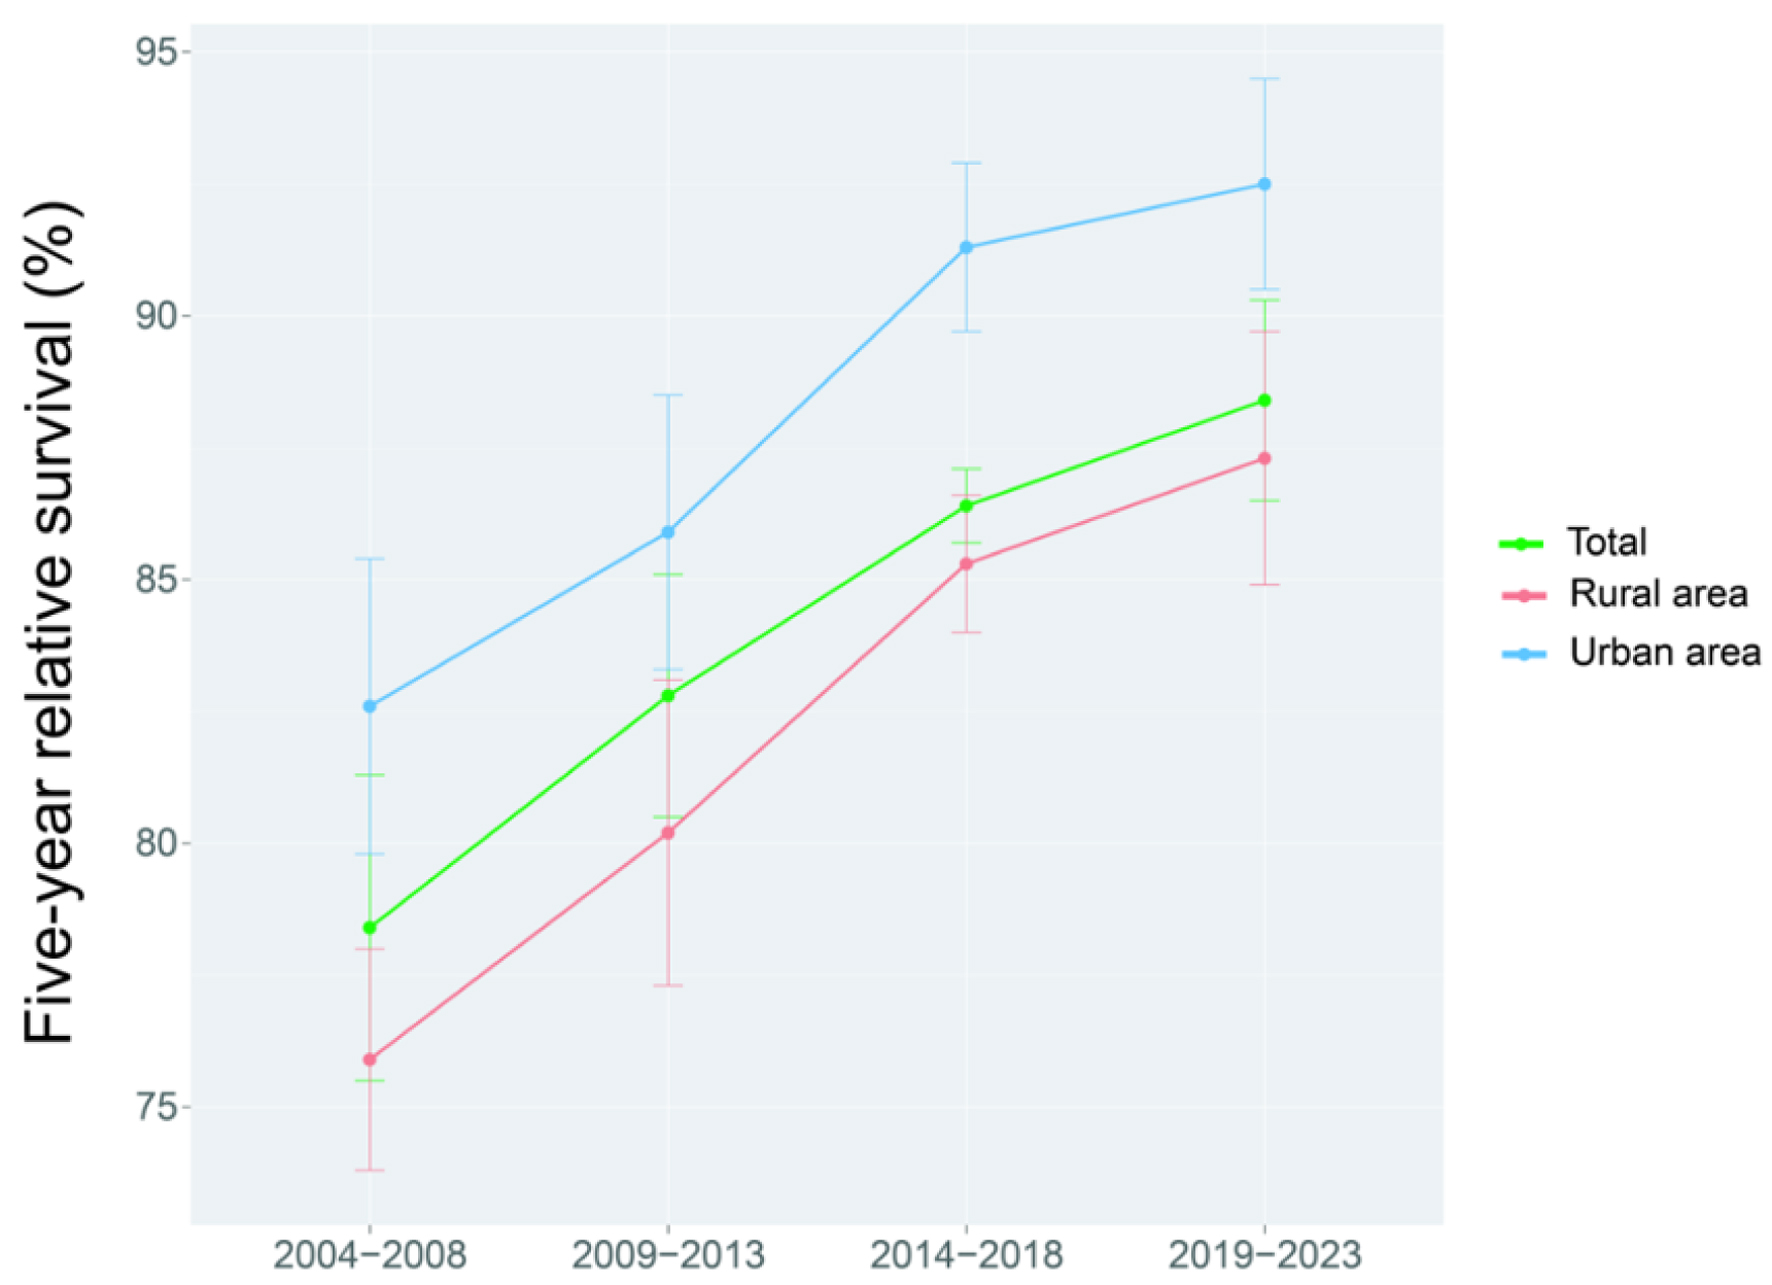
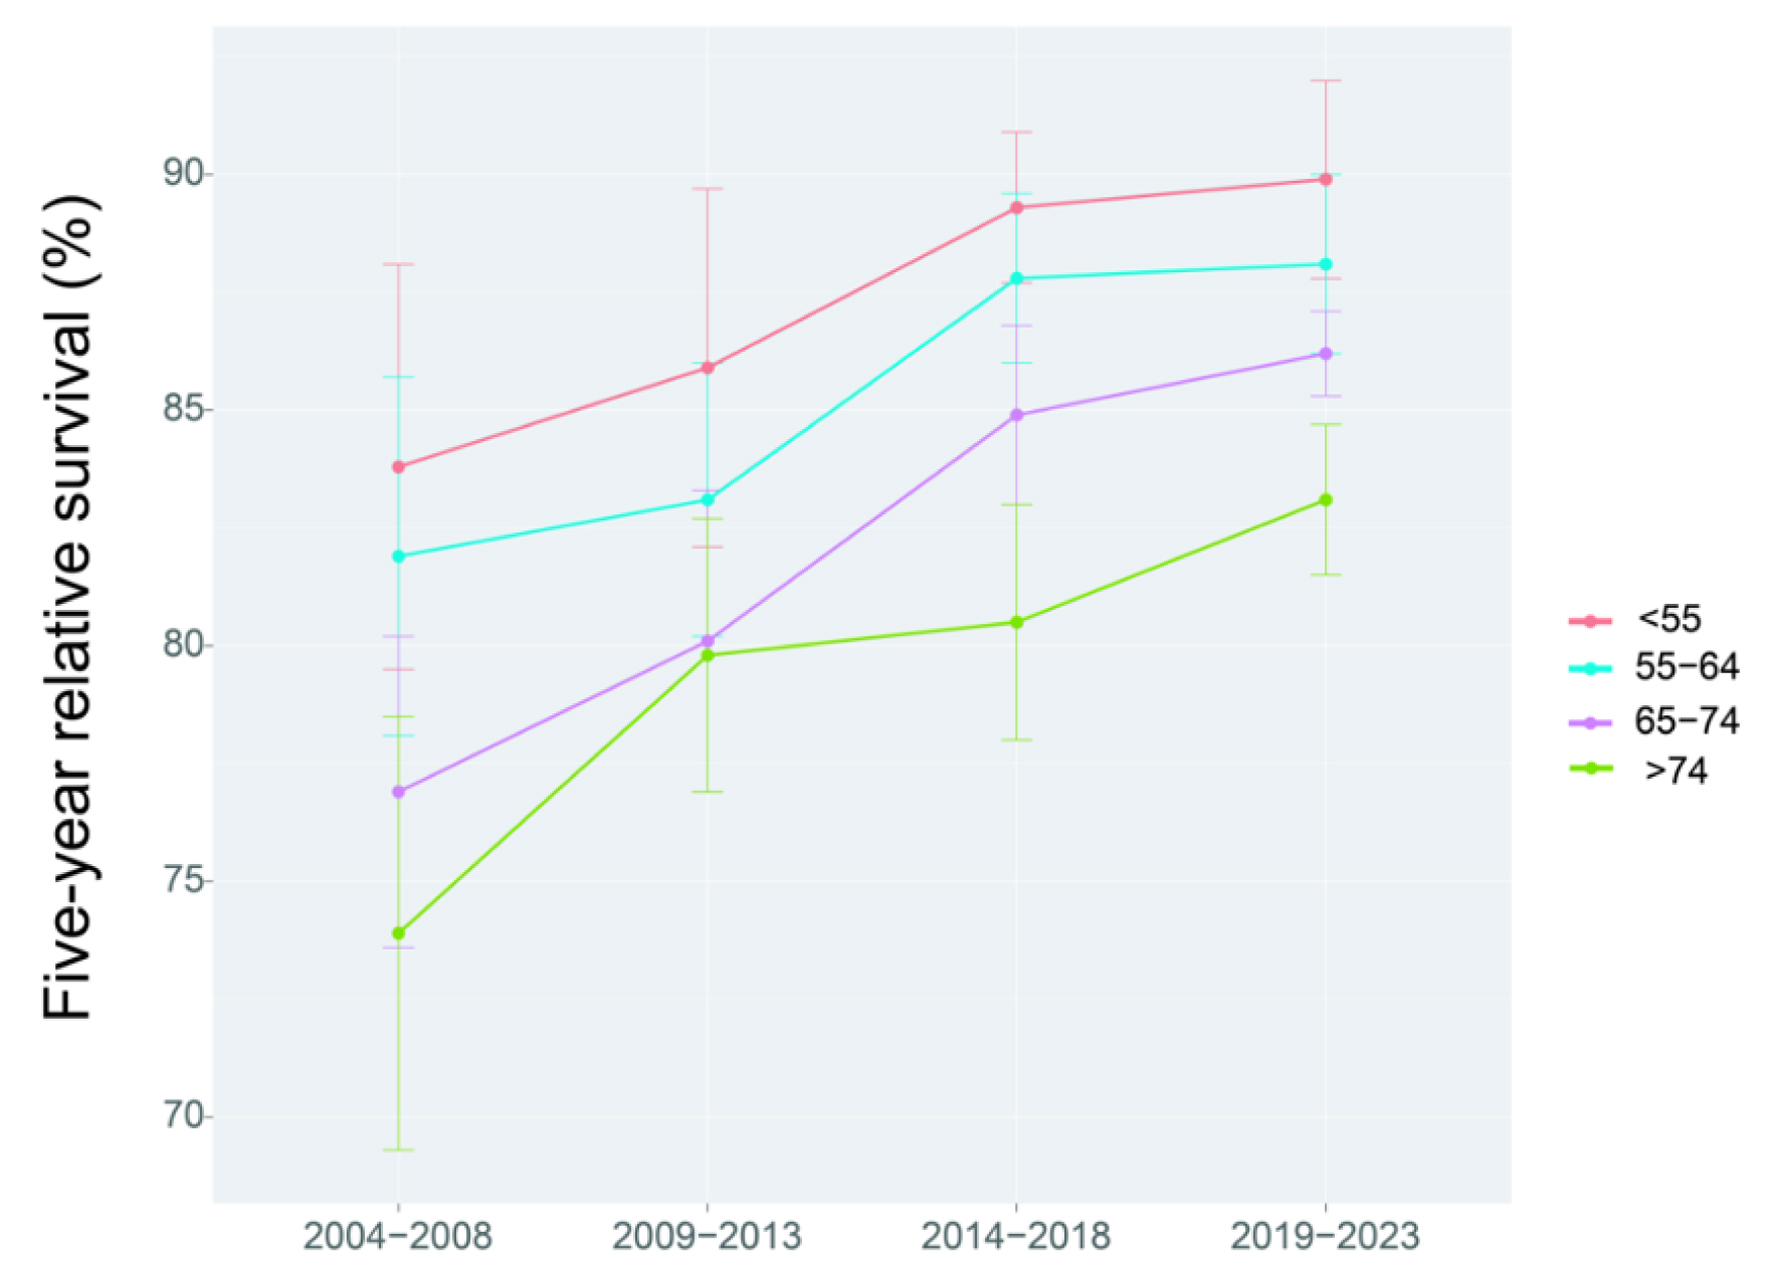
| Estimated value (%) | Standard error | |
|---|---|---|
| Total | 86.4 | 0.7 |
| Region | ||
| Urban area | 91.3 | 1.6 |
| Rural area | 85.3 | 1.3 |
| Age at diagnosis (years) | ||
| < 55 | 89.3 | 1.6 |
| 55 - 64 | 87.8 | 1.8 |
| 65 - 74 | 84.9 | 1.9 |
| > 74 | 80.5 | 2.5 |
| Estimated value (%) | |
|---|---|
| Total | 88.4 |
| Region | |
| Urban area | 92.5 |
| Rural area | 87.3 |
| Age at diagnosis (years) | |
| < 55 | 89.9 |
| 55 - 64 | 88.1 |
| 65 - 74 | 86.2 |
| > 74 | 83.1 |