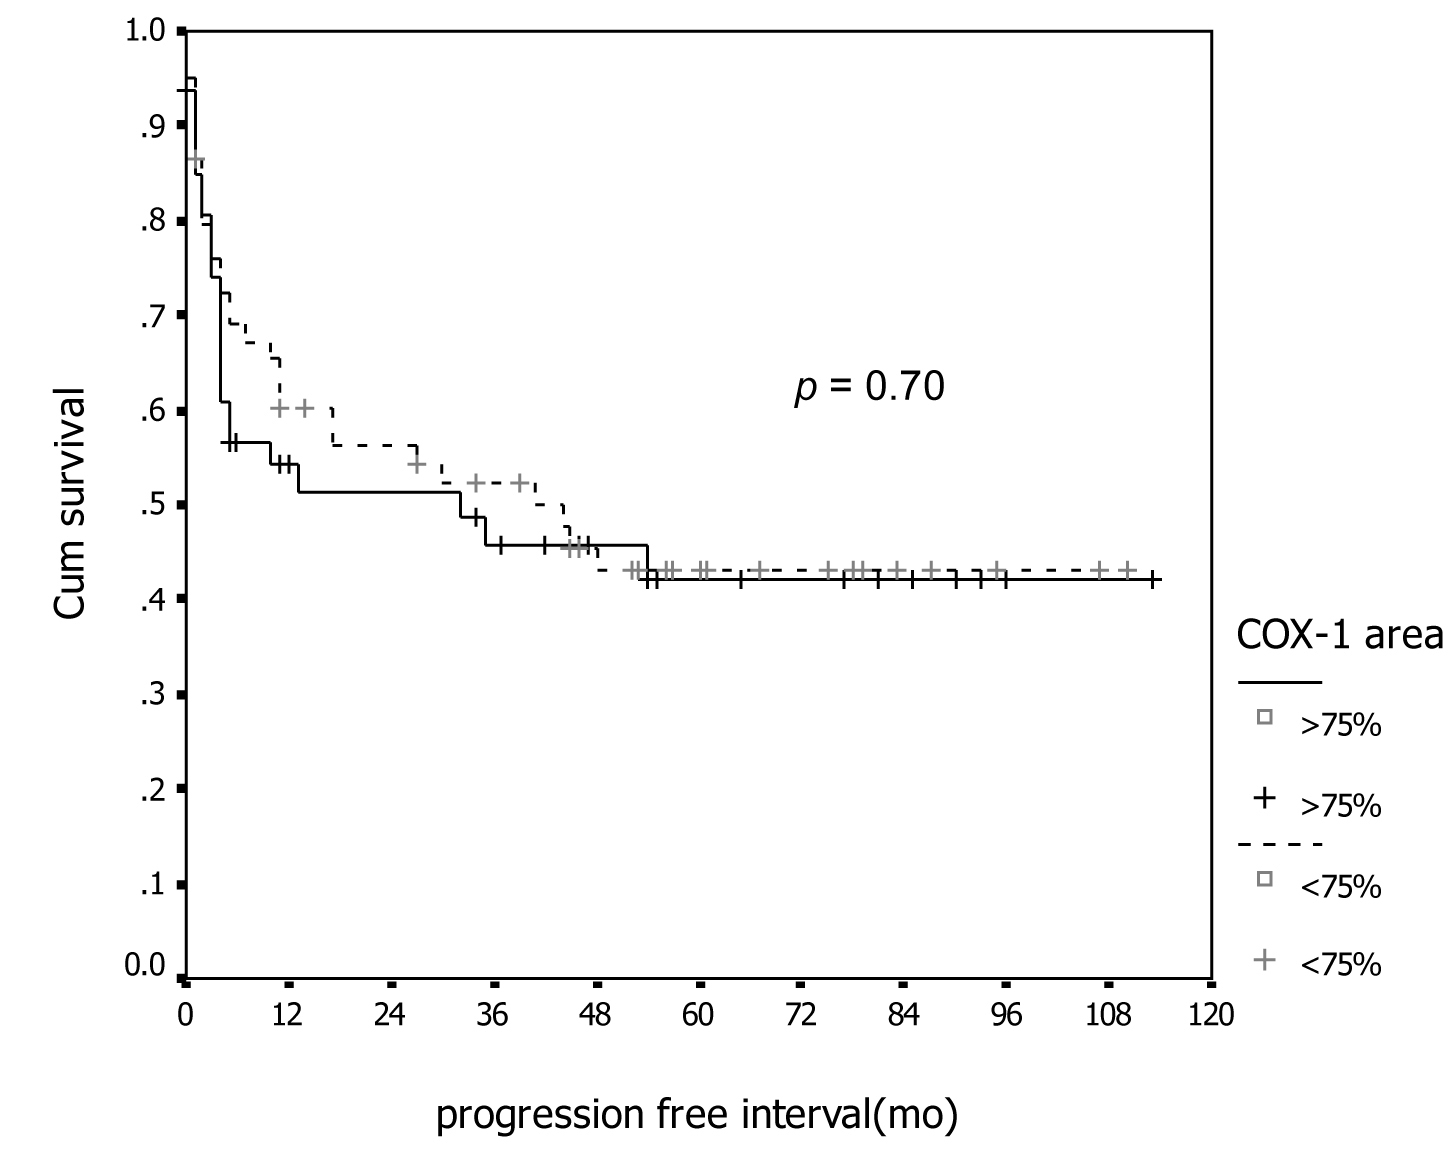
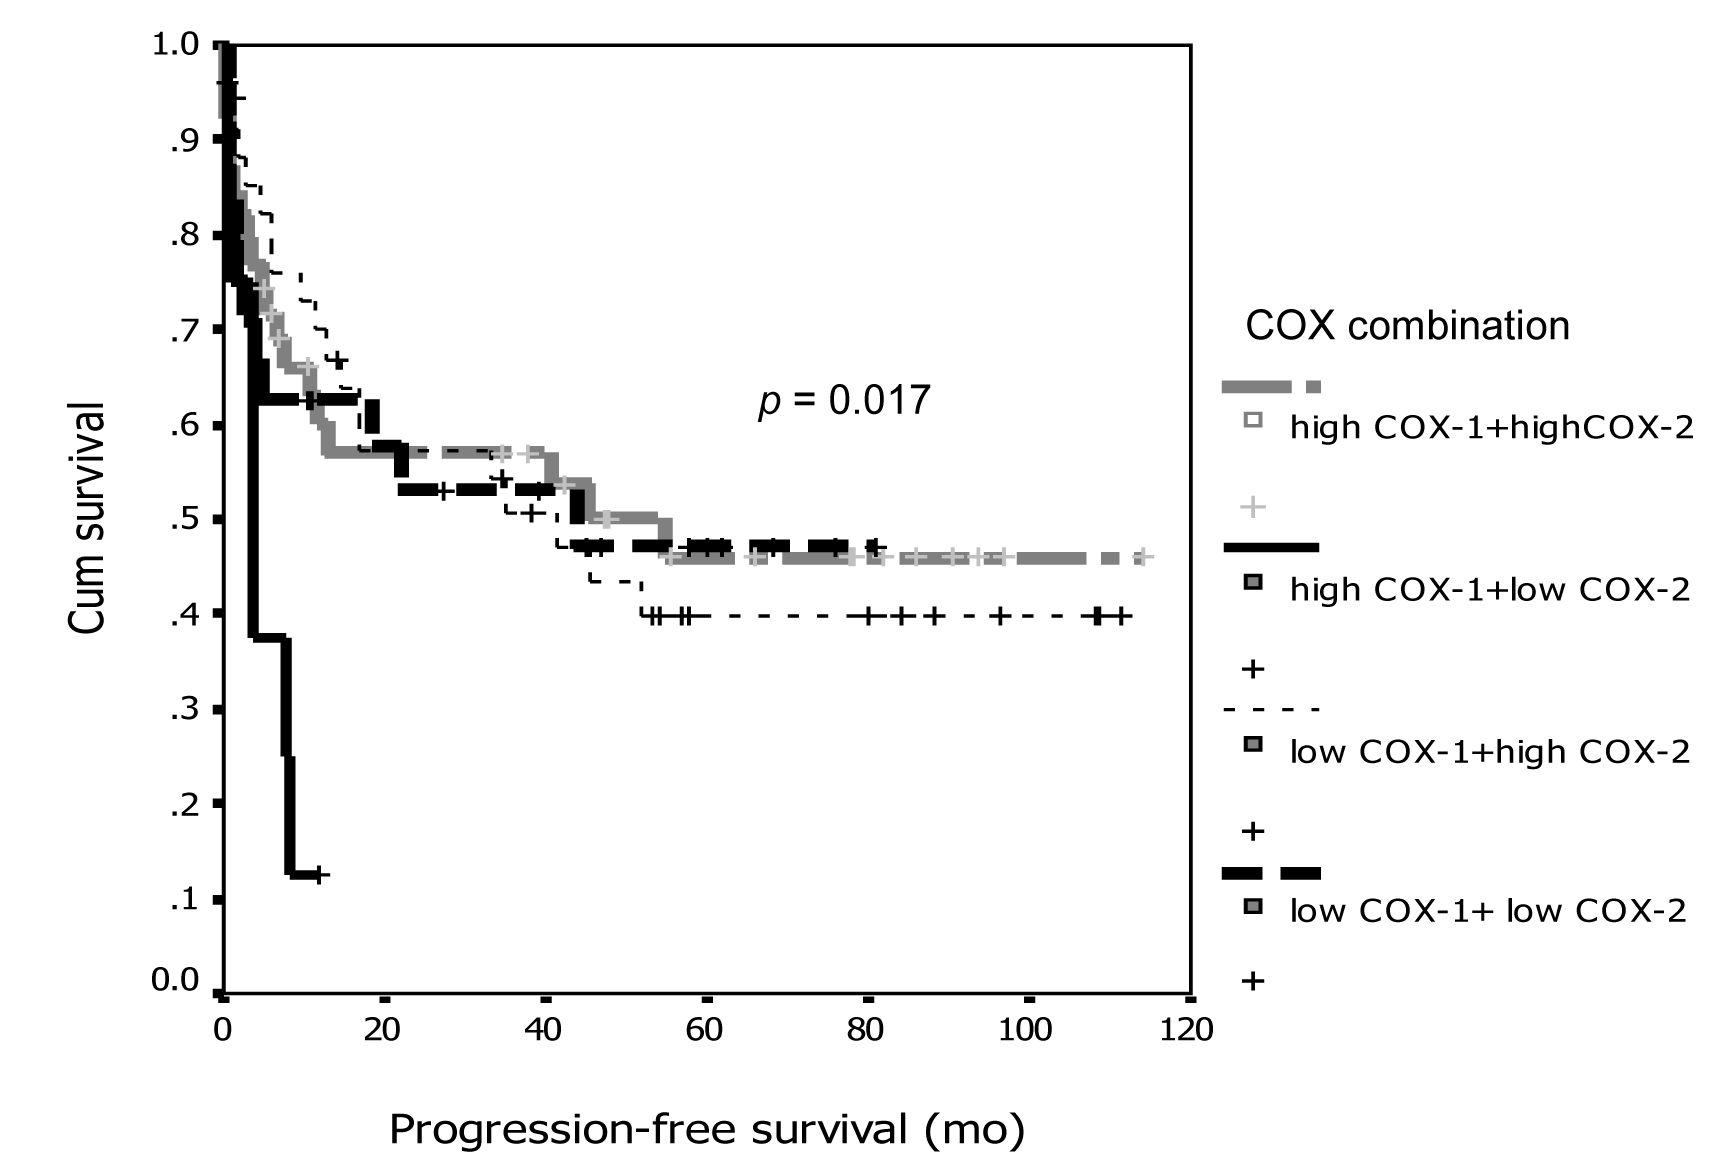
Figure 1. Association between COX-1 immunostaining and progression-free survival.
| World Journal of Oncology, ISSN 1920-4531 print, 1920-454X online, Open Access |
| Article copyright, the authors; Journal compilation copyright, World J Oncol and Elmer Press Inc |
| Journal website http://www.wjon.org |
Original Article
Volume 1, Number 1, February 2010, pages 19-27
Expression of Cyclooxygenase-1 and 2 in Epithelial Ovarian Cancer: A Clinicopathologic Study
Figures
Tables
| Characteristics | N (%) |
|---|---|
| Age; year, median (range) | 50 (24-84) |
| Menopausal status | |
| premenopause | 51 (47.7) |
| postmenopause | 56 (52.3) |
| Result of surgery | |
| complete surgery | 101 (94.4) |
| incomplete surgery | 6 (5.6) |
| Residual tumor | |
| no residual tumor | 56 (52.3) |
| ≤ 2 cm | 35 (32.7) |
| > 2 cm | 16 (15.0) |
| Histology | |
| serous | 32 (29.9) |
| mucinous | 25 (23.4) |
| endometrioid | 16 (15.0) |
| clear cell | 14 (13.1) |
| adenocarcinoma, not otherwise specified | 12 (11.2) |
| mixed epithelium | 7 (6.5) |
| adenosquamous | 1 (0.9) |
| Grade | |
| G1 | 18 (16.9) |
| G2 | 35 (32.7) |
| G3 | 54 (50.4) |
| FIGO Staging | |
| stage I | 47 (43.9) |
| stage II | 7 (6.5) |
| stage III | 44 (41.1) |
| stage IV | 9 (8.4) |
| Adjuvant chemotherapy | |
| no adjuvant therapy | 19 (17.8) |
| adjuvant chemotherapy | 88 (82.2) |
| Total | 107 |
| Area of Expression | COX-1 N (%) | COX-2 N (%) |
|---|---|---|
| ≤ 5% | 18 (16.8) | 5 (4.7) |
| 6 - 25% | 17 (15.9) | 3 (2.8) |
| 26 - 50% | 14 (13.1) | 9 (8.4) |
| 51 - 75% | 11 (10.3) | 16 (15.0) |
| ≥ 76% | 47 (43.9) | 74 (69.2) |
| Clinical data | N | COX-1 area expression; N (%) | p | COX-2 area expression; N (%) | p | ||
|---|---|---|---|---|---|---|---|
| ≤ 75% n = 60 | > 75% n = 47 | ≤ 75% n = 33 | > 75% n = 74 | ||||
| Age | |||||||
| ≤ 60 years | 79 | 47 (59.5) | 32 (40.5) | 0.23 | 28 (35.4) | 51 (64.6) | 0.08 |
| > 60 years | 28 | 13 (46.4) | 15 (53.6) | 5 (17.9) | 23 (82.1) | ||
| Menopausal status | |||||||
| premenopause | 51 | 28 (54.9) | 23 (45.1) | 0.82 | 16 (31.4) | 35 (68.6) | 0.91 |
| postmenopause | 56 | 32 (57.1) | 24 (42.9) | 17 (30.4) | 39 (69.6) | ||
| Residual tumor | |||||||
| no residual tumor | 56 | 31 (55.4) | 25 (44.6) | 0.87 | 20 (35.7) | 36 (64.3) | 0.25 |
| residual tumor | 51 | 29 (56.9) | 22 (43.1) | 13 (25.5) | 38 (74.5) | ||
| Histology | |||||||
| mucinous | 25 | 19 (76.0) | 6 (24.0) | 0.02 | 14 (56.0) | 11 (44.0) | 0.002 |
| non-mucinous | 82 | 41 (50.0) | 41 (50.0) | 19 (23.2) | 63 (76.8) | ||
| Tumor grade | |||||||
| G1-2 | 53 | 31 (58.5) | 22 (41.5) | 0.62 | 21 (39.6) | 32 (60.4) | 0.05 |
| G3 | 54 | 29 (53.7) | 25 (46.3) | 12 (22.2) | 42 (77.8) | ||
| FIGO Staging | |||||||
| stage 1-2 | 54 | 30 (55.6) | 24 (44.4) | 0.91 | 20 (37.0) | 34 (63.0) | 0.16 |
| stage 3-4 | 53 | 30 (56.6) | 23 (43.4) | 13 (24.5) | 40 (75.5) | ||
| Response to first line | N = 88 | n = 48 | n = 40 | n = 26 | n = 62 | ||
| chemotherapy | 0.38 | 0.01 | |||||
| response | 55 | 32 (58.2) | 23 (41.8) | 11 (20.0) | 44 (80.0) | ||
| no response | 33 | 16 (48.5) | 17 (51.5) | 15 (45.5) | 18 (54.5) | ||
| Clinical data | Multivariate analysis | |
|---|---|---|
| Hazard ratio (95% CI) | p | |
| Age | ||
| ≤ 60 years | 2.29 | 0.013 |
| > 60 years | (1.19 – 4.39) | |
| Residual disease | ||
| no residual | 2.93 | 0.05 |
| residual | (1.00 – 8.62) | |
| Histology | ||
| Mucinous | 3.68 | 0.004 |
| Non-mucinous | (1.51 – 8.94) | |
| Tumor grade | ||
| Grade 1-2 | 2.00 | 0.059 |
| Grade 3 | (0.98 – 4.10) | |
| FIGO stage | ||
| Stage 1-2 | 4.17 | 0.018 |
| Stage 3-4 | (1.27 – 13.70) | |
| COX -1 and COX-2 expression | ||
| Others group | 5.90 | < 0.0001 |
| High COX-1 and low COX-2 | (2.38 – 14.59) | |