Figures
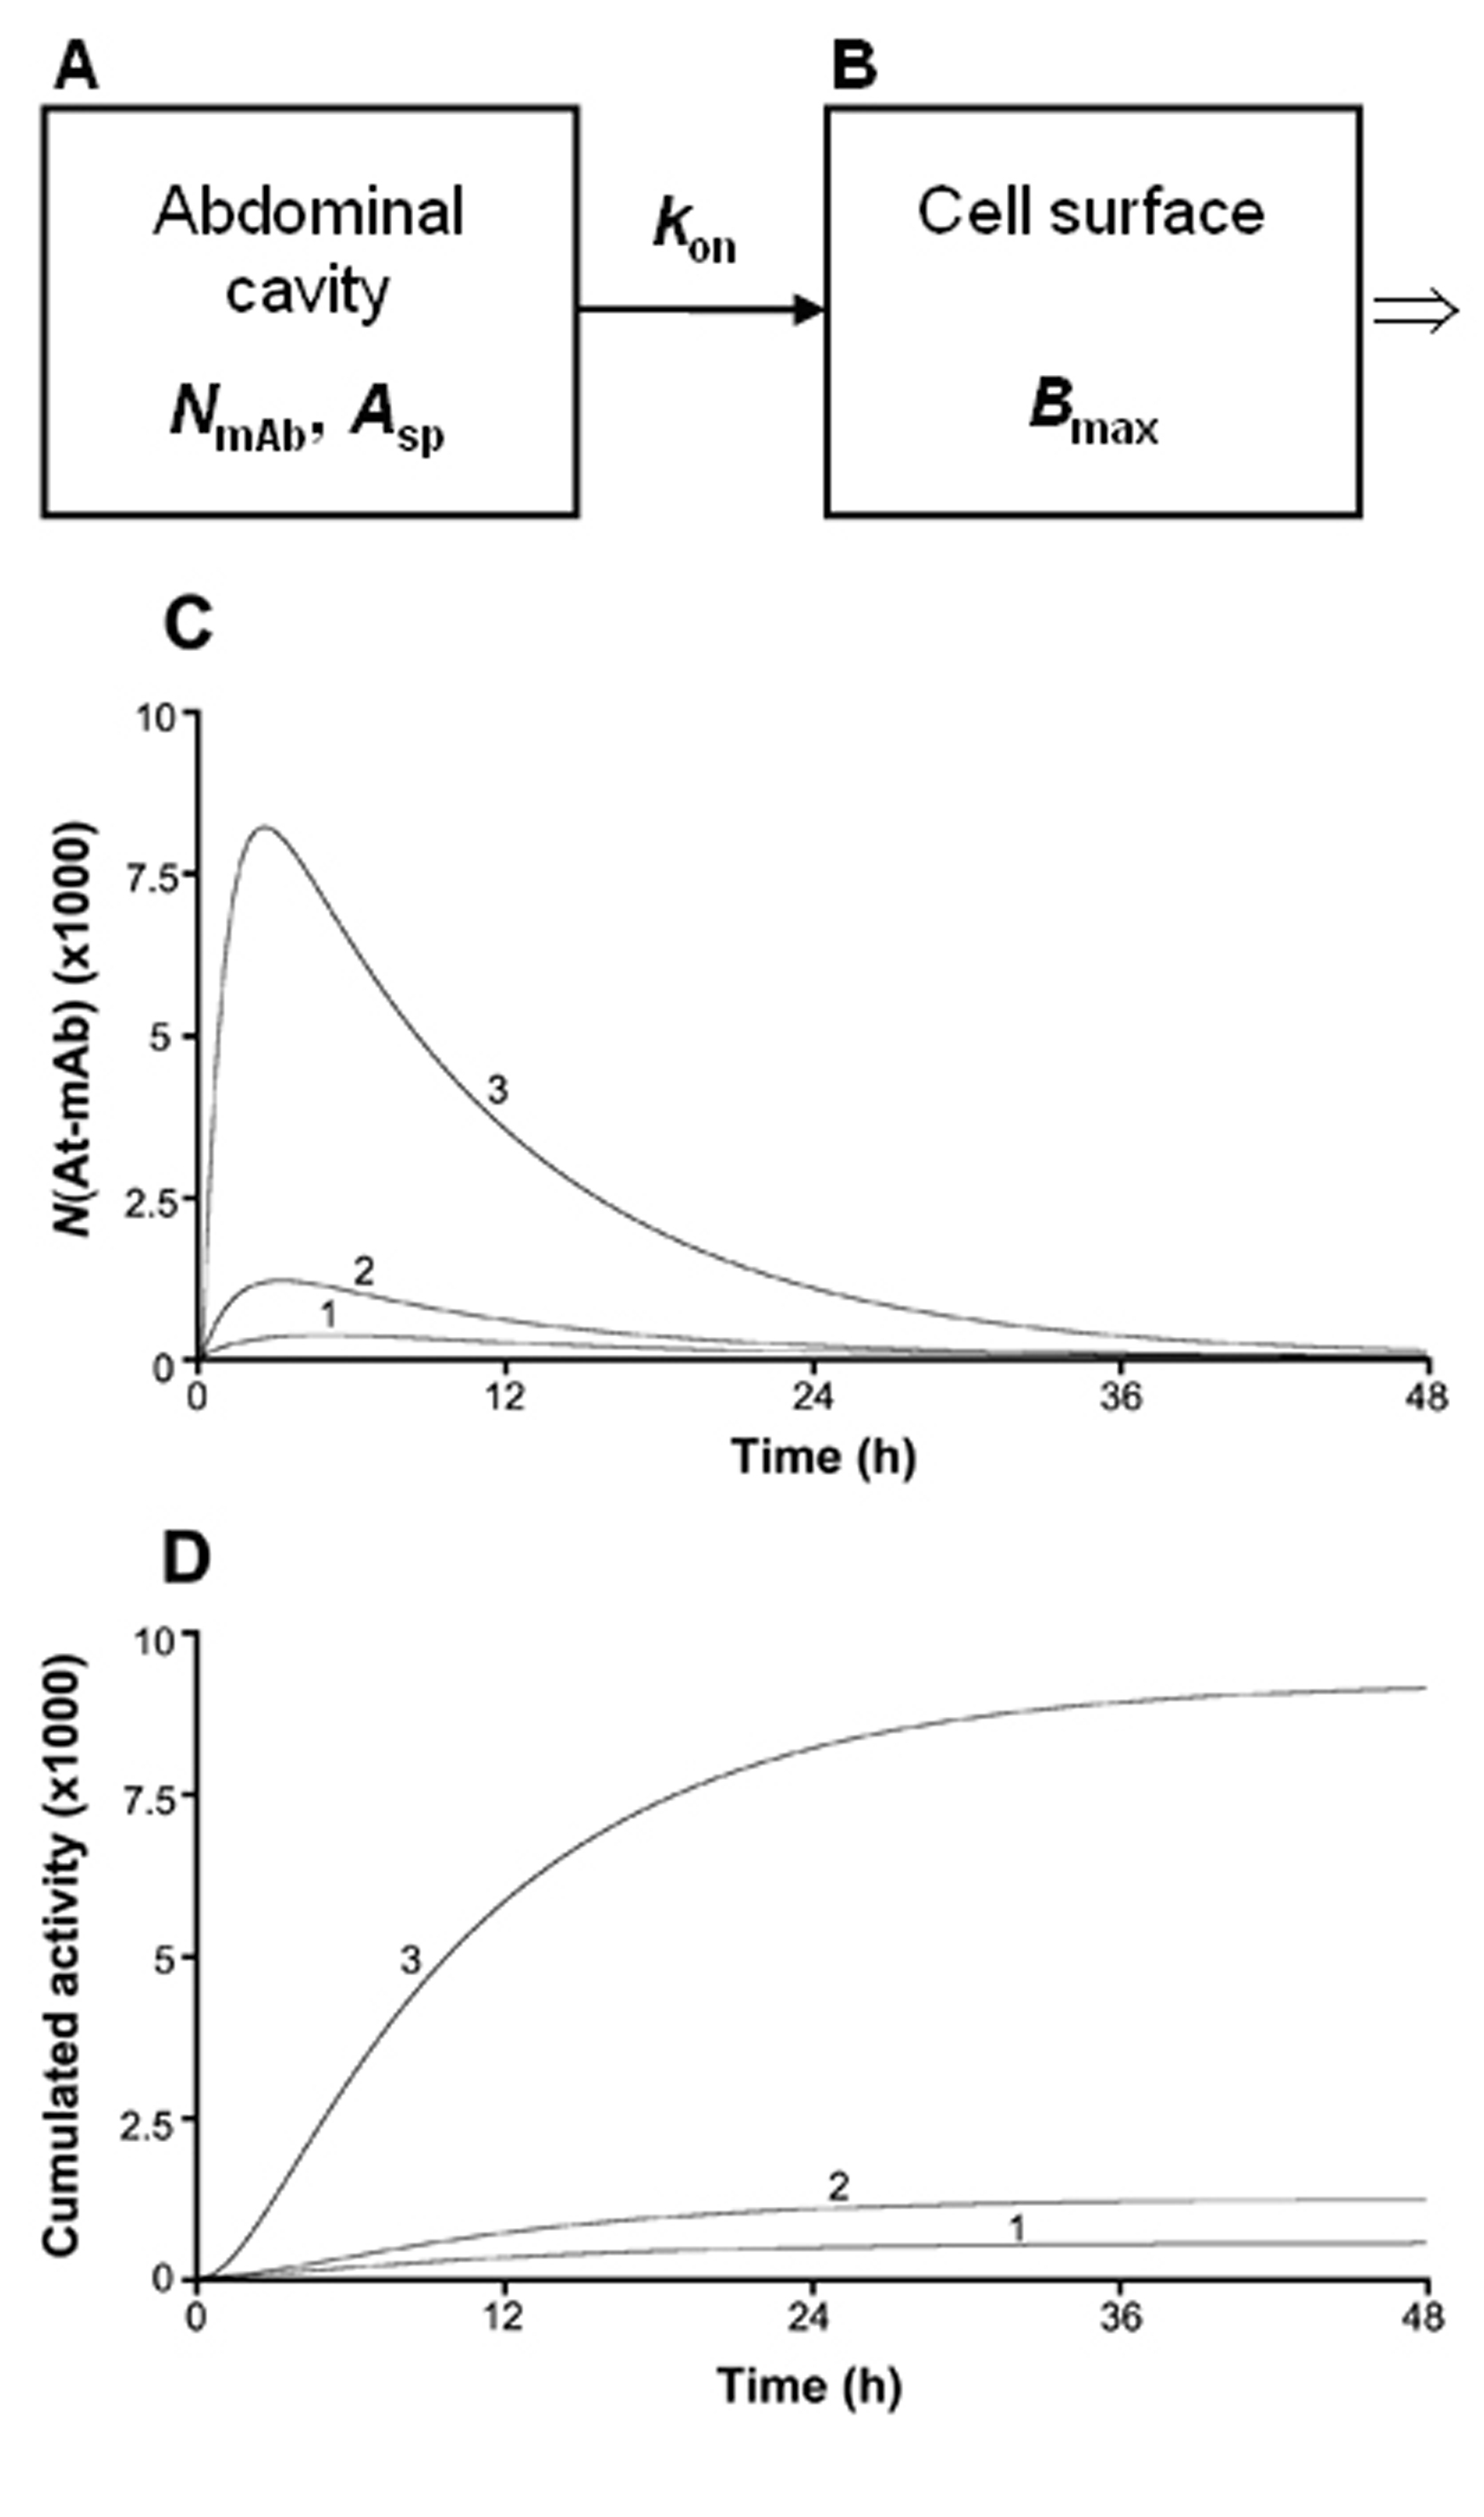
Figure 1. The computational model used for investigating of how the cumulated activity on a tumor cell surface varies for different specific activities (Asp). NmAb in compartment A is the total number of mAbs injected in the abdominal cavity. kon is the rate at which the mAbs are bound to the antigenic sites on the cell surface per unit time for a specific antigen concentration, and Bmax in compartment B is the total number of antigens present on one tumor cell. Bmax was in the above calculations set to 106, a value previously determined in vitro for the OVCAR-3 cells. NAt-mAb is the number of 211At atoms situated on the tumor cell surface at certain times after injection. Curve 1, 2, and 3 in panel C and D corresponds to a specific activity equal to 1/1200, 1/500, and 1/80 211At atom/mAbs, respectively.
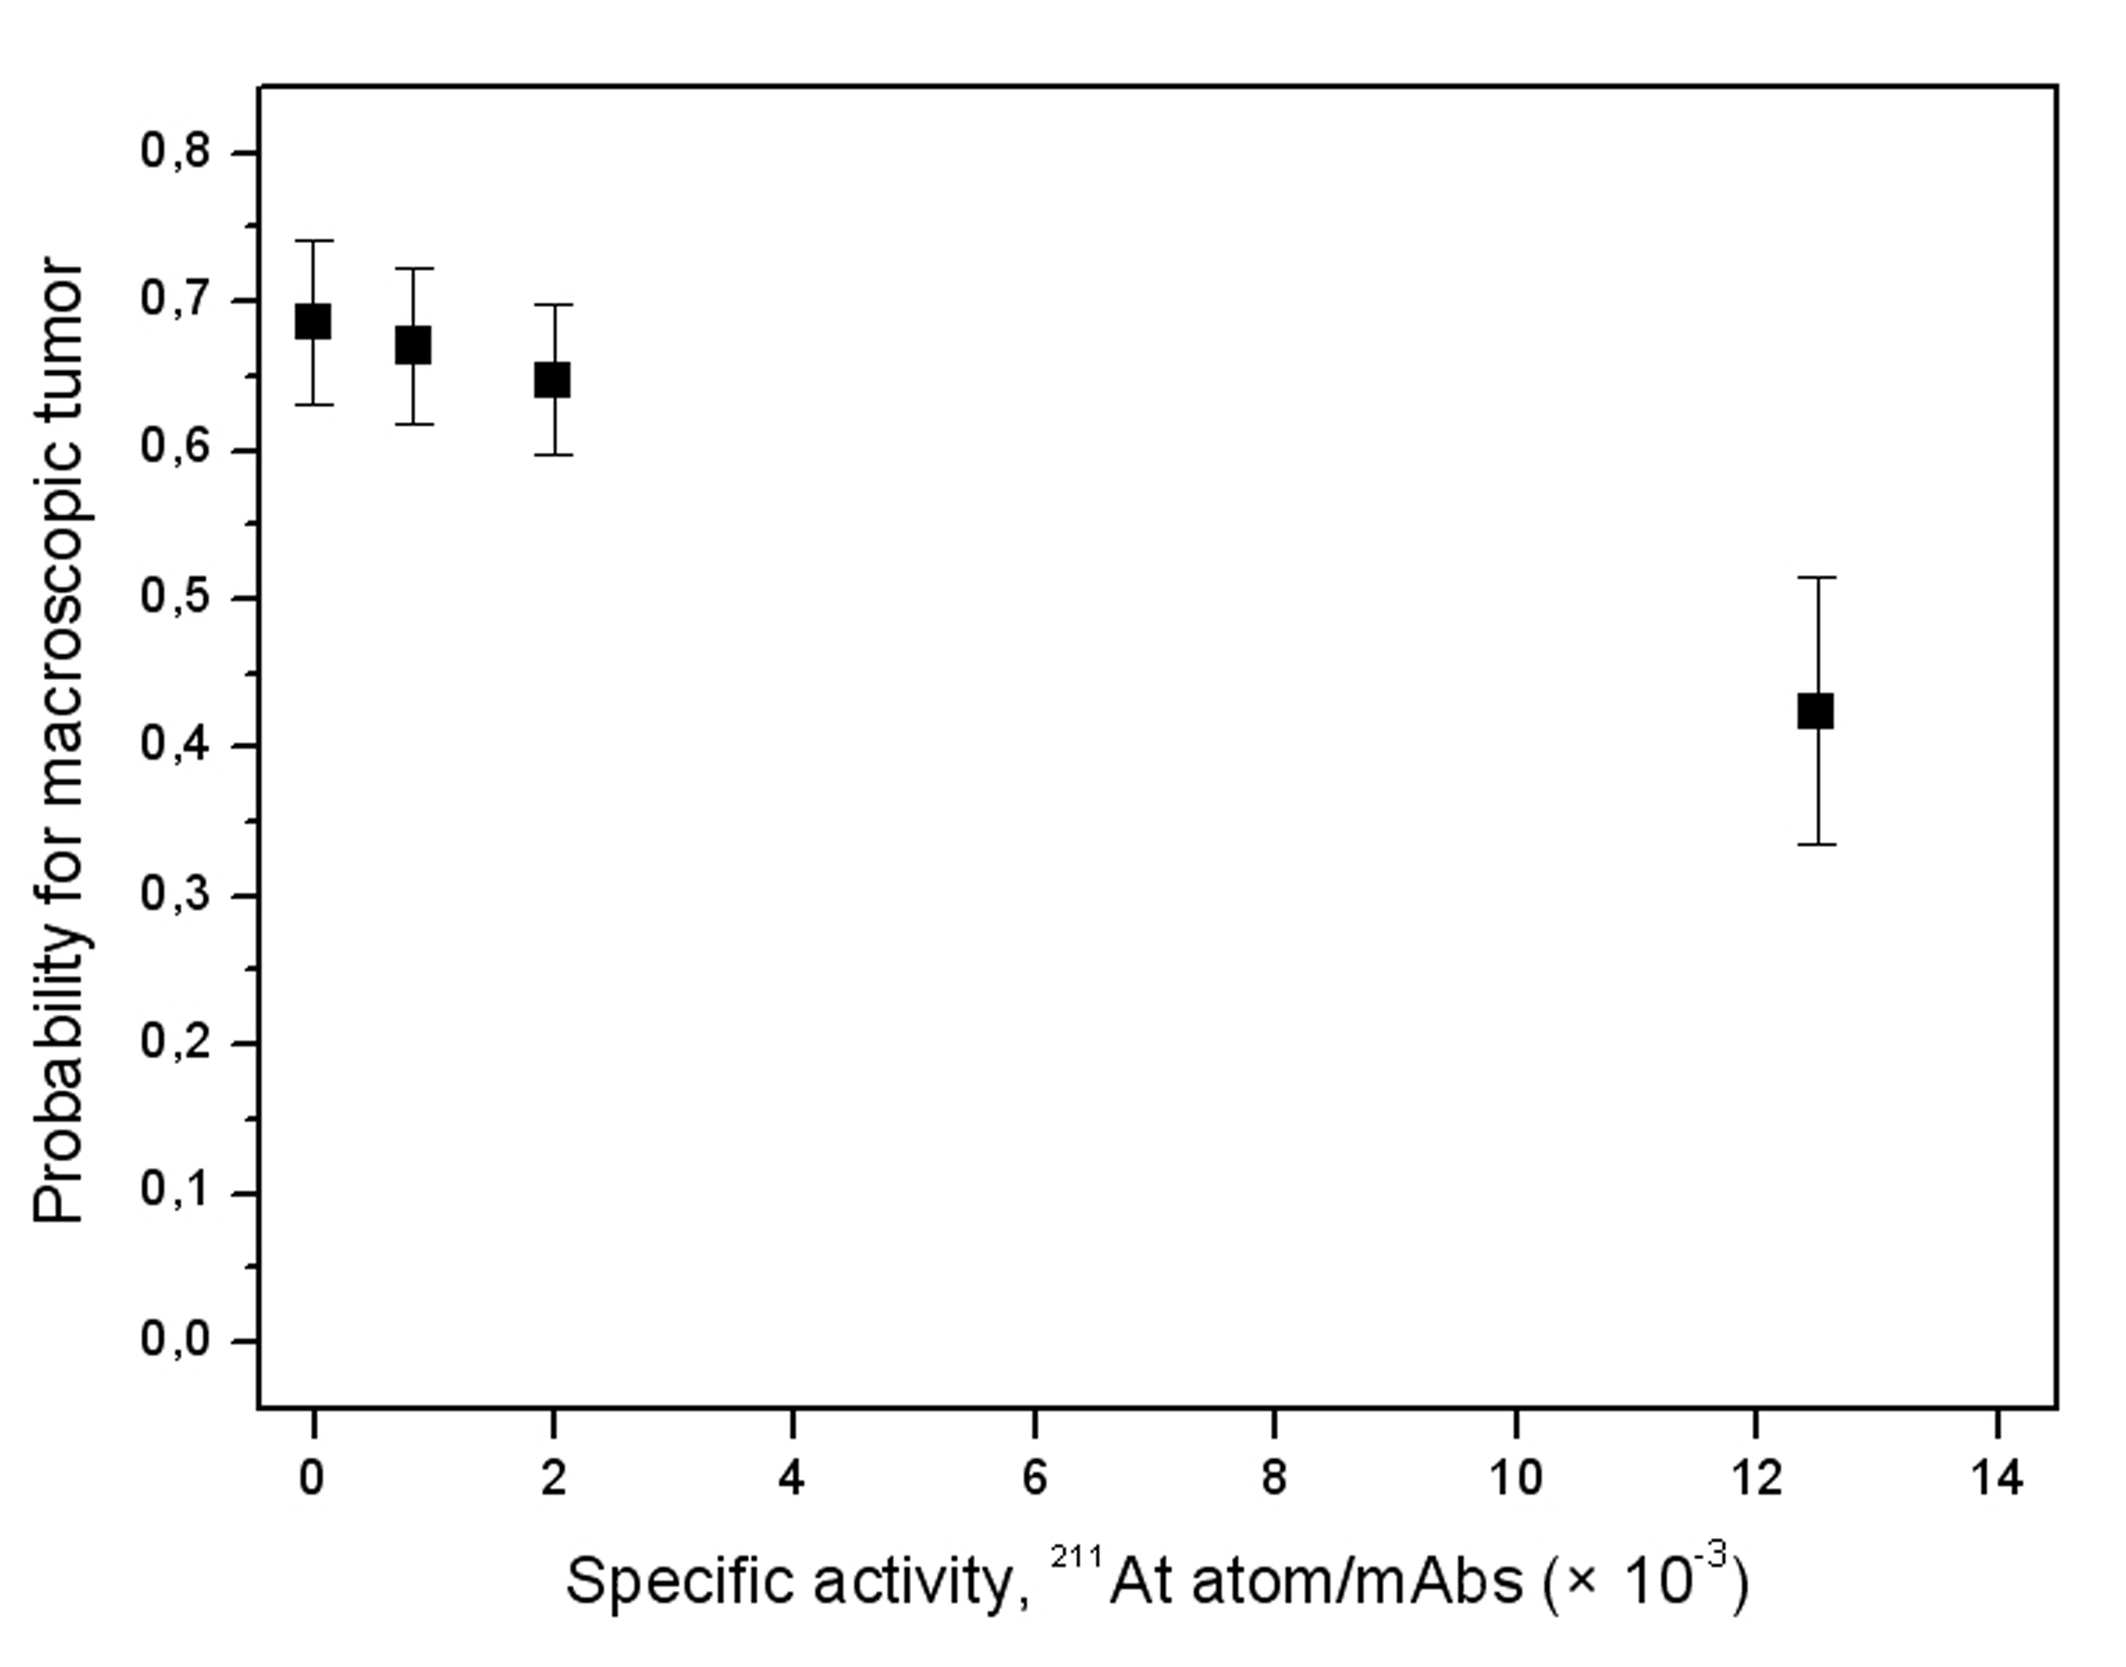
Figure 2. Probability for macroscopic tumor as a function of the specific activity (± SEM). Controls were given PBS (n = 10) or unlabeled MX35 F(ab′)2 in PBS (n = 10). Each specific activity level (n = 30) includes all 3 treatment levels (25, 50, and 400 kBq MX35 F(ab′)2).
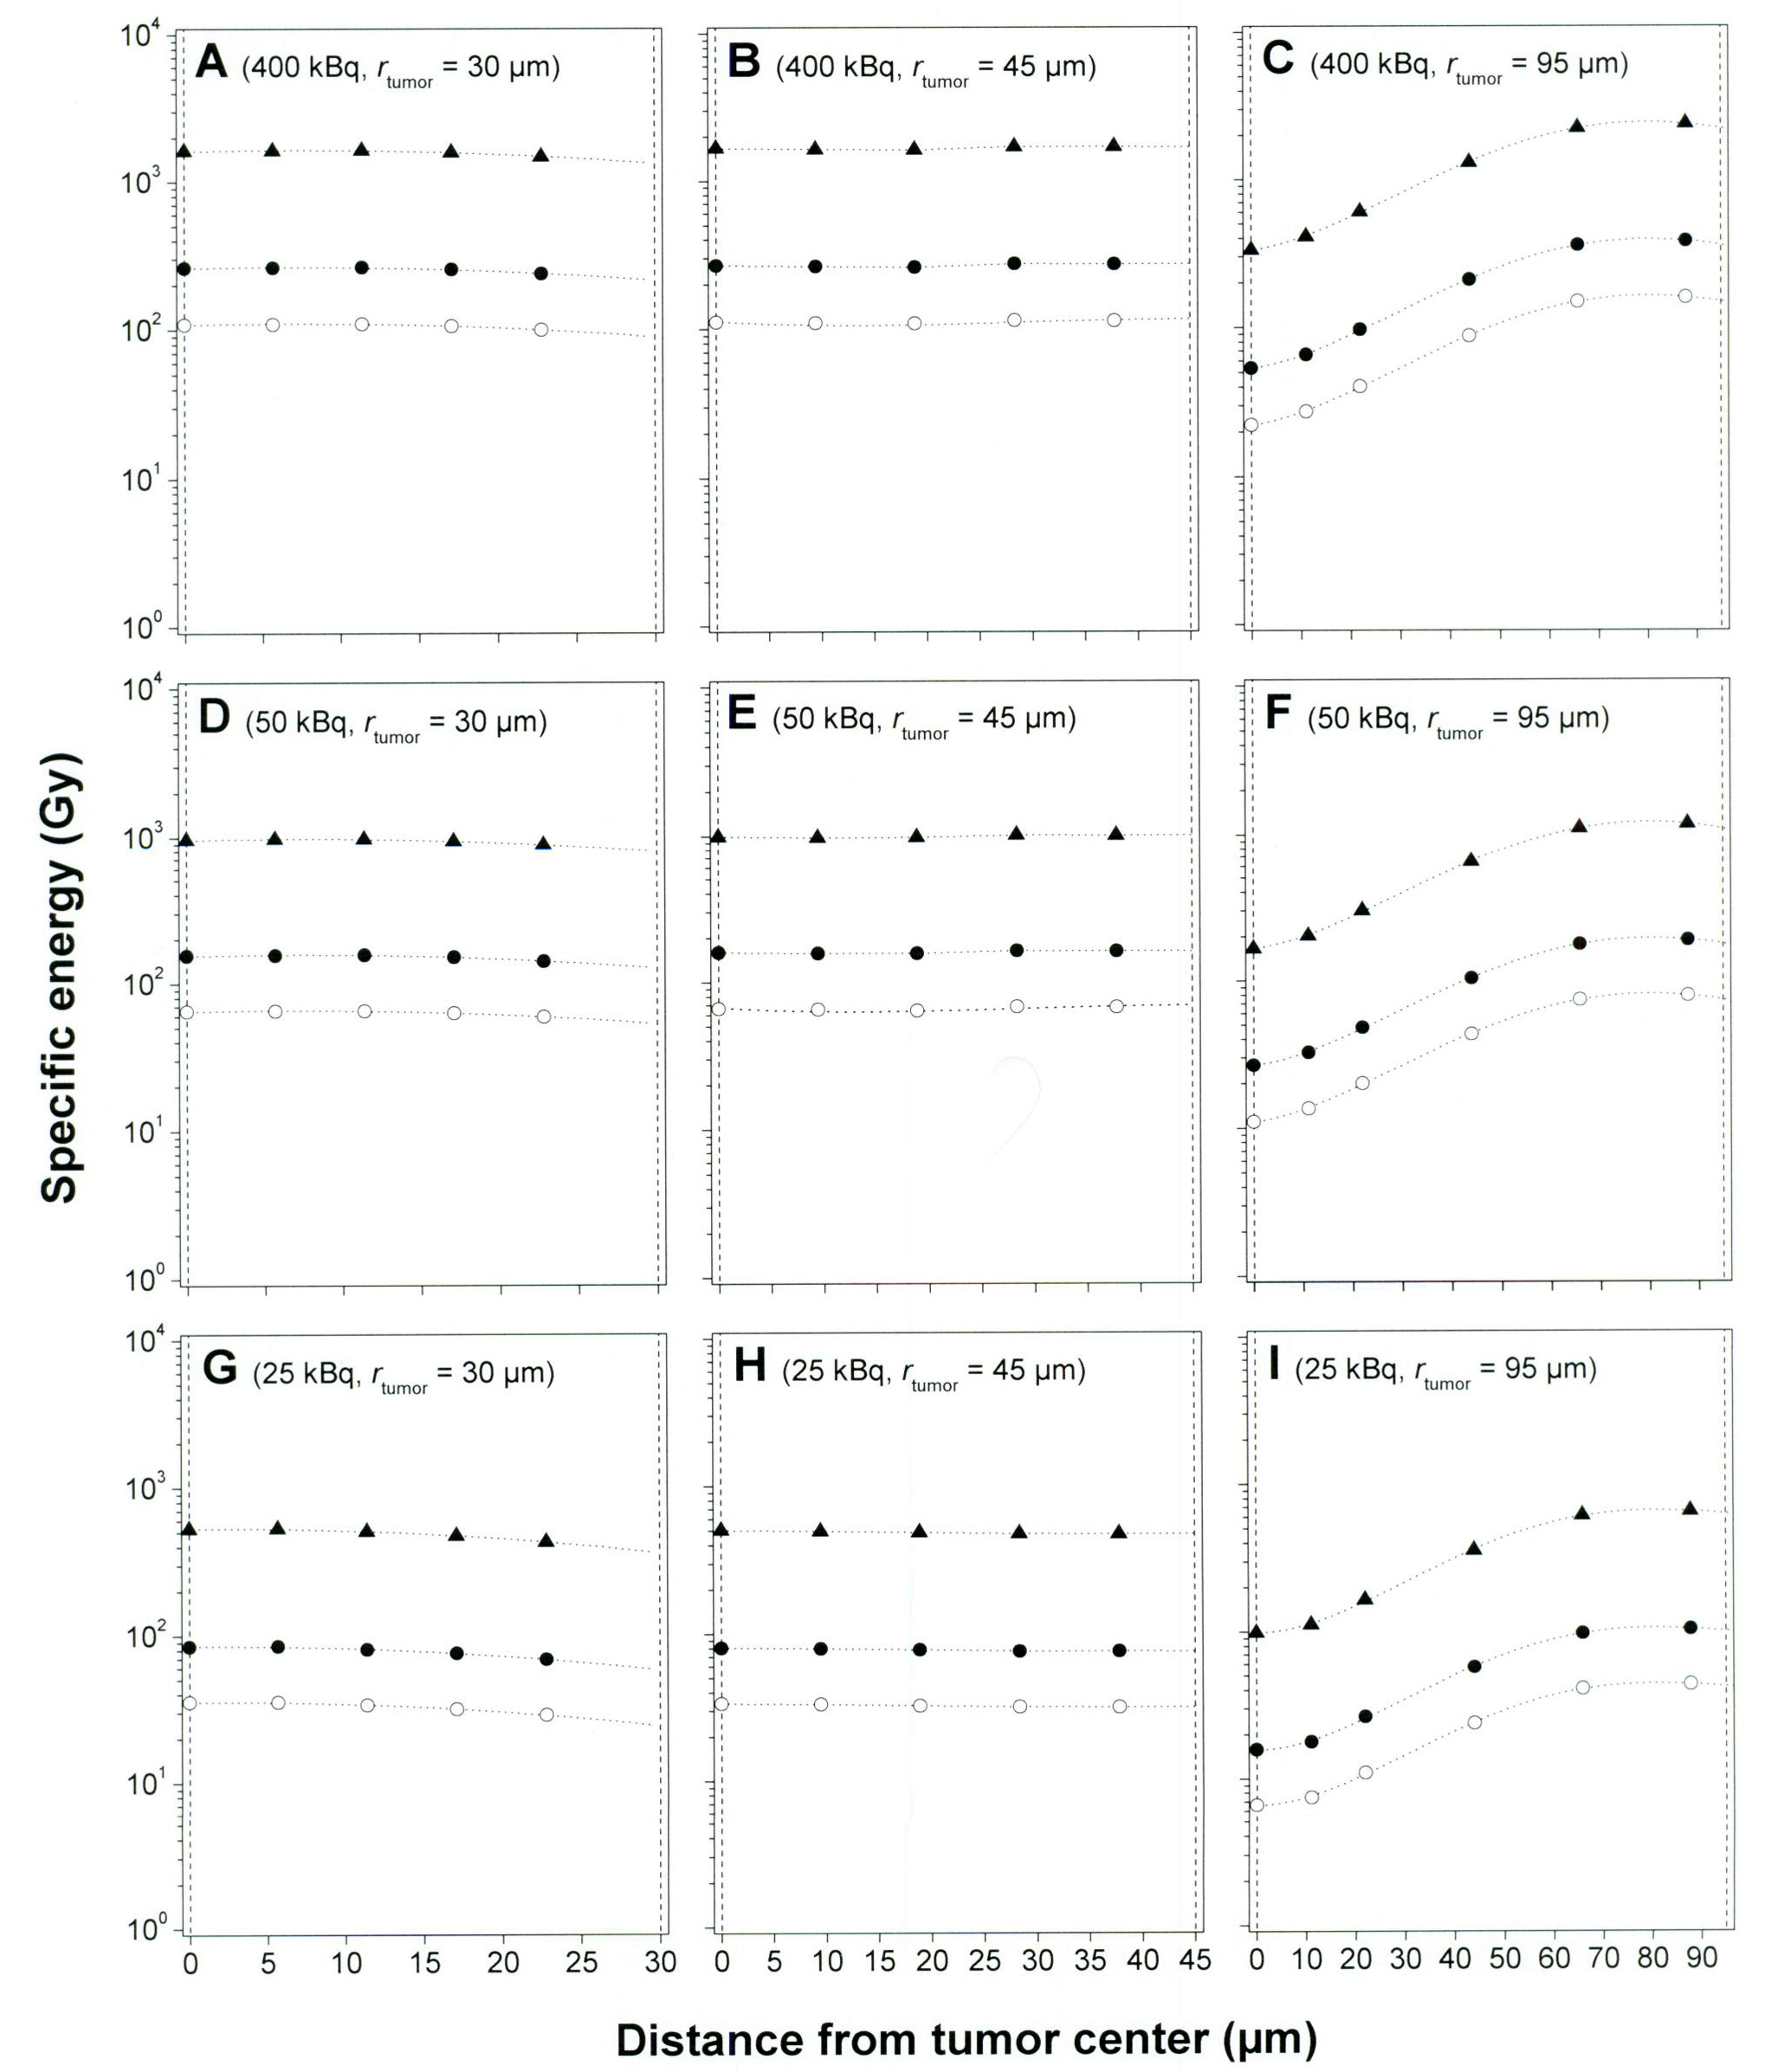
Figure 3. Specific energy imparted to a cell nucleus situated at different distances from the tumor center. The calculations were performed for 3 tumor sizes: 30, 45, and 95 µm radius; 3 activity levels: 25, 50, and 400 kBq 211At MX35 F(ab′)2; and 3 specific activity levels: 1/80 (▲), 1/500 (•), and 1/1200 (○) 211At atom/mAbs. A diffusion depth of 30 µm into each tumor was assumed for the radioactivity in all calculations. The vertical dashed lines in each panel represent the tumor center and surface, respectively.
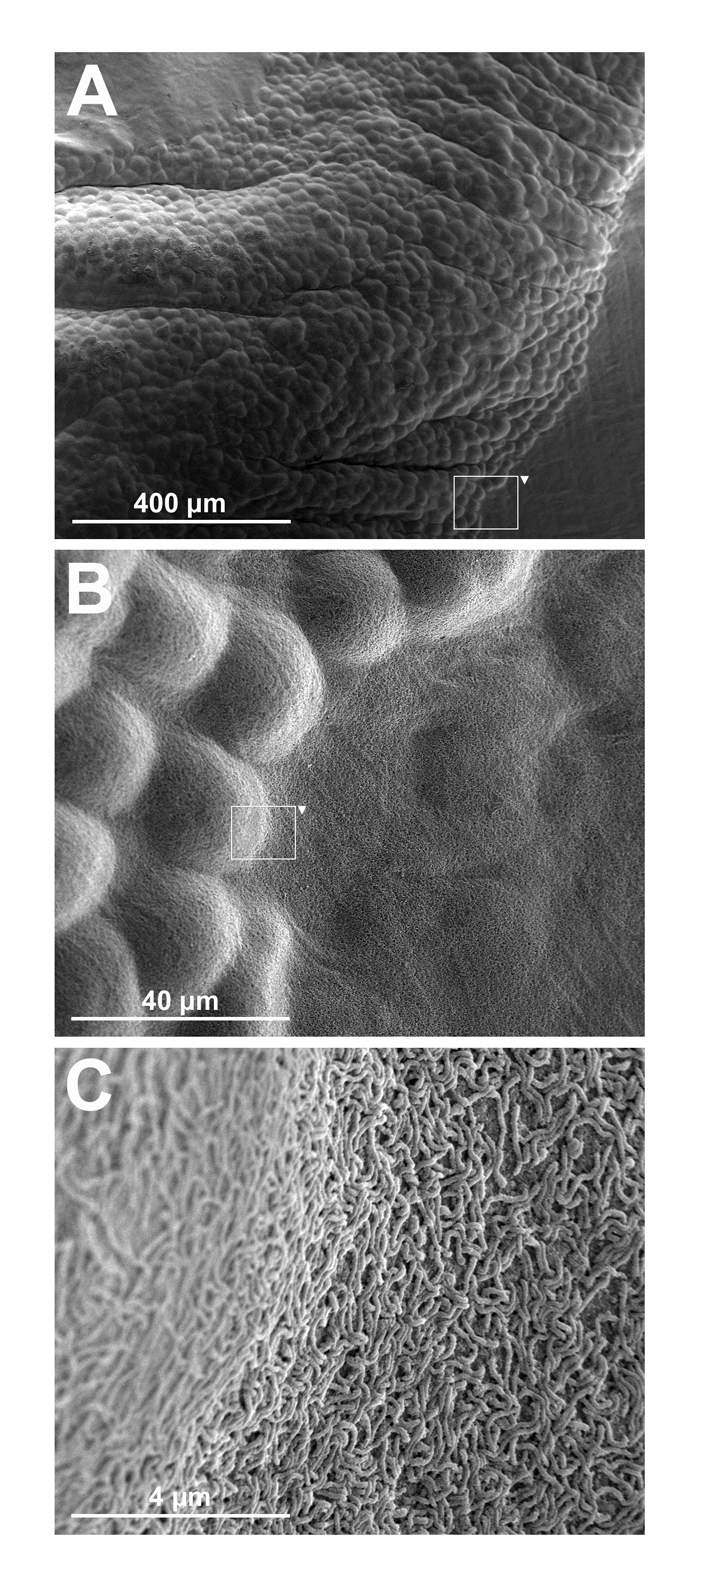
Figure 4. Scanning electron-microscopy images of macroscopic tumors on the peritoneum in nude mice at the time of dissection. Panel A shows a part of a macroscopic tumor several millimeters in length visible to the naked eye. Panel B shows an enlargement of a segment shown in panel A illustrating how the tumor cells disseminate under the mesothelial cell layer of the peritoneum. Panel C shows an enlargement of a segment shown in panel B, illustrating the microvilli covered transition from tumor to healthy tissue.
Table
Table 1. Study Groups and Number of Mice with Macroscopic Tumors
| Group | n | Treatment | Specific activity (At atom/mAbs) | Macroscopic tumors |
|---|
| 1 | 10 | 25 kBq 211At-MX35 F(ab′)2 in PBS | l/80 | 5/10 |
| 2 | 10 | 50 kBq 211At-MX35 F(ab′)2 in PBS | l/80 | 4/10 |
| 3 | 10 | 400 kBq 211At-MX35 F(ab′)2 in PBS | l/80 | 4/10 |
| 4 | 10 | 25 kBq 211At-MX35 F(ab′)2 in PBS | l/500 | 7/10 |
| 5 | 10 | 50 kBq 211At-MX35 F(ab′)2 in PBS | l/500 | 5/10 |
| 6 | 10 | 400 kBq 211At-MX35 F(ab′)2 in PBS | l/500 | 5/10 |
| 7 | 10 | 25 kBq 211At-MX35 F(ab′)2 in PBS | l/1200 | 5/10 |
| 8 | 10 | 50 kBq 211At-MX35 F(ab′)2 in PBS | l/1200 | 9/10 |
| 9 | 10 | 400 kBq 211At-MX35 F(ab′)2 in PBS | l/1200 | 8/10 |
| 10 | 10 | PBS | – | 7/10 |
| 11 | 10 | MX35 F(ab′)2 in PBS | – | 7/10 |