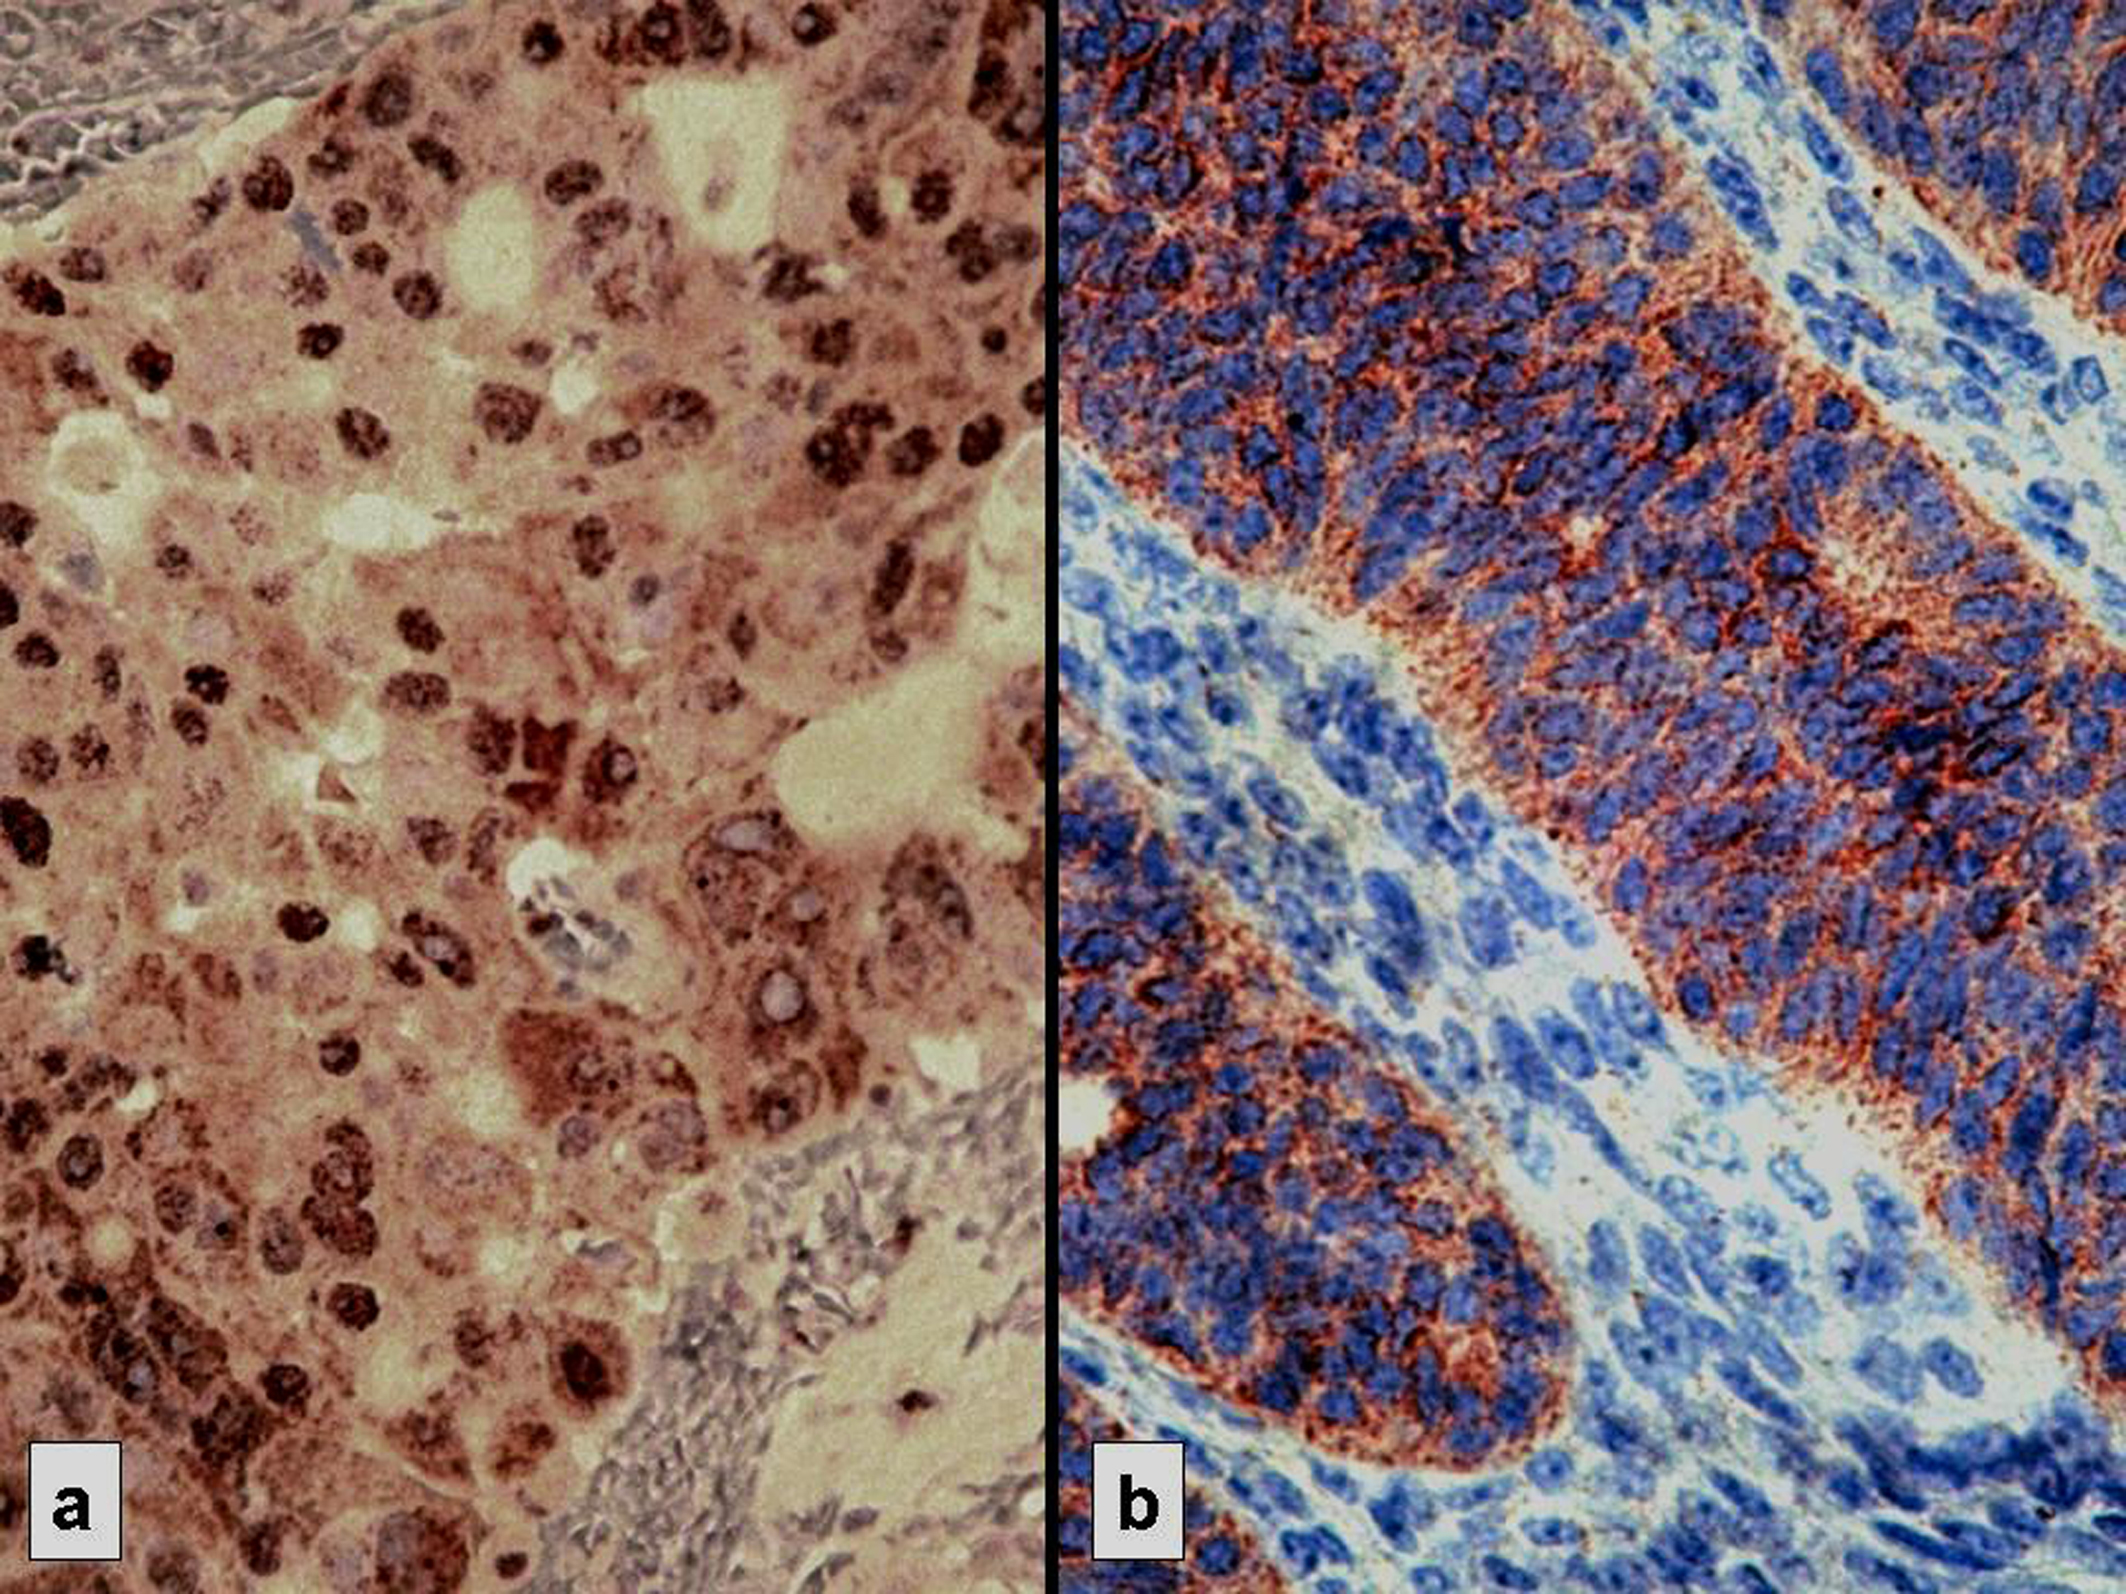
Figure 1. Strong immunostaining: nuclear for p53 (a) and cytoplasmic for Bcl-2 (b)
| World Journal of Oncology, ISSN 1920-4531 print, 1920-454X online, Open Access |
| Article copyright, the authors; Journal compilation copyright, World J Oncol and Elmer Press Inc |
| Journal website http://www.wjon.org |
Original Article
Volume 1, Number 3, June 2010, pages 118-128
Correlation Between Immunohistochemical Biomarkers Expression and Prognosis of Ovarian Carcinomas in Tunisian Patients
Figures
Tables
| N | % | |
|---|---|---|
| ER: Estrogen receptor; PR: Progesterone receptor; CPR: complete pathologic response; micro only: microscopic residual disease only. | ||
| Age | ||
| ≤ 55 years | 31 | 54.4 |
| > 55 years | 26 | 45.6 |
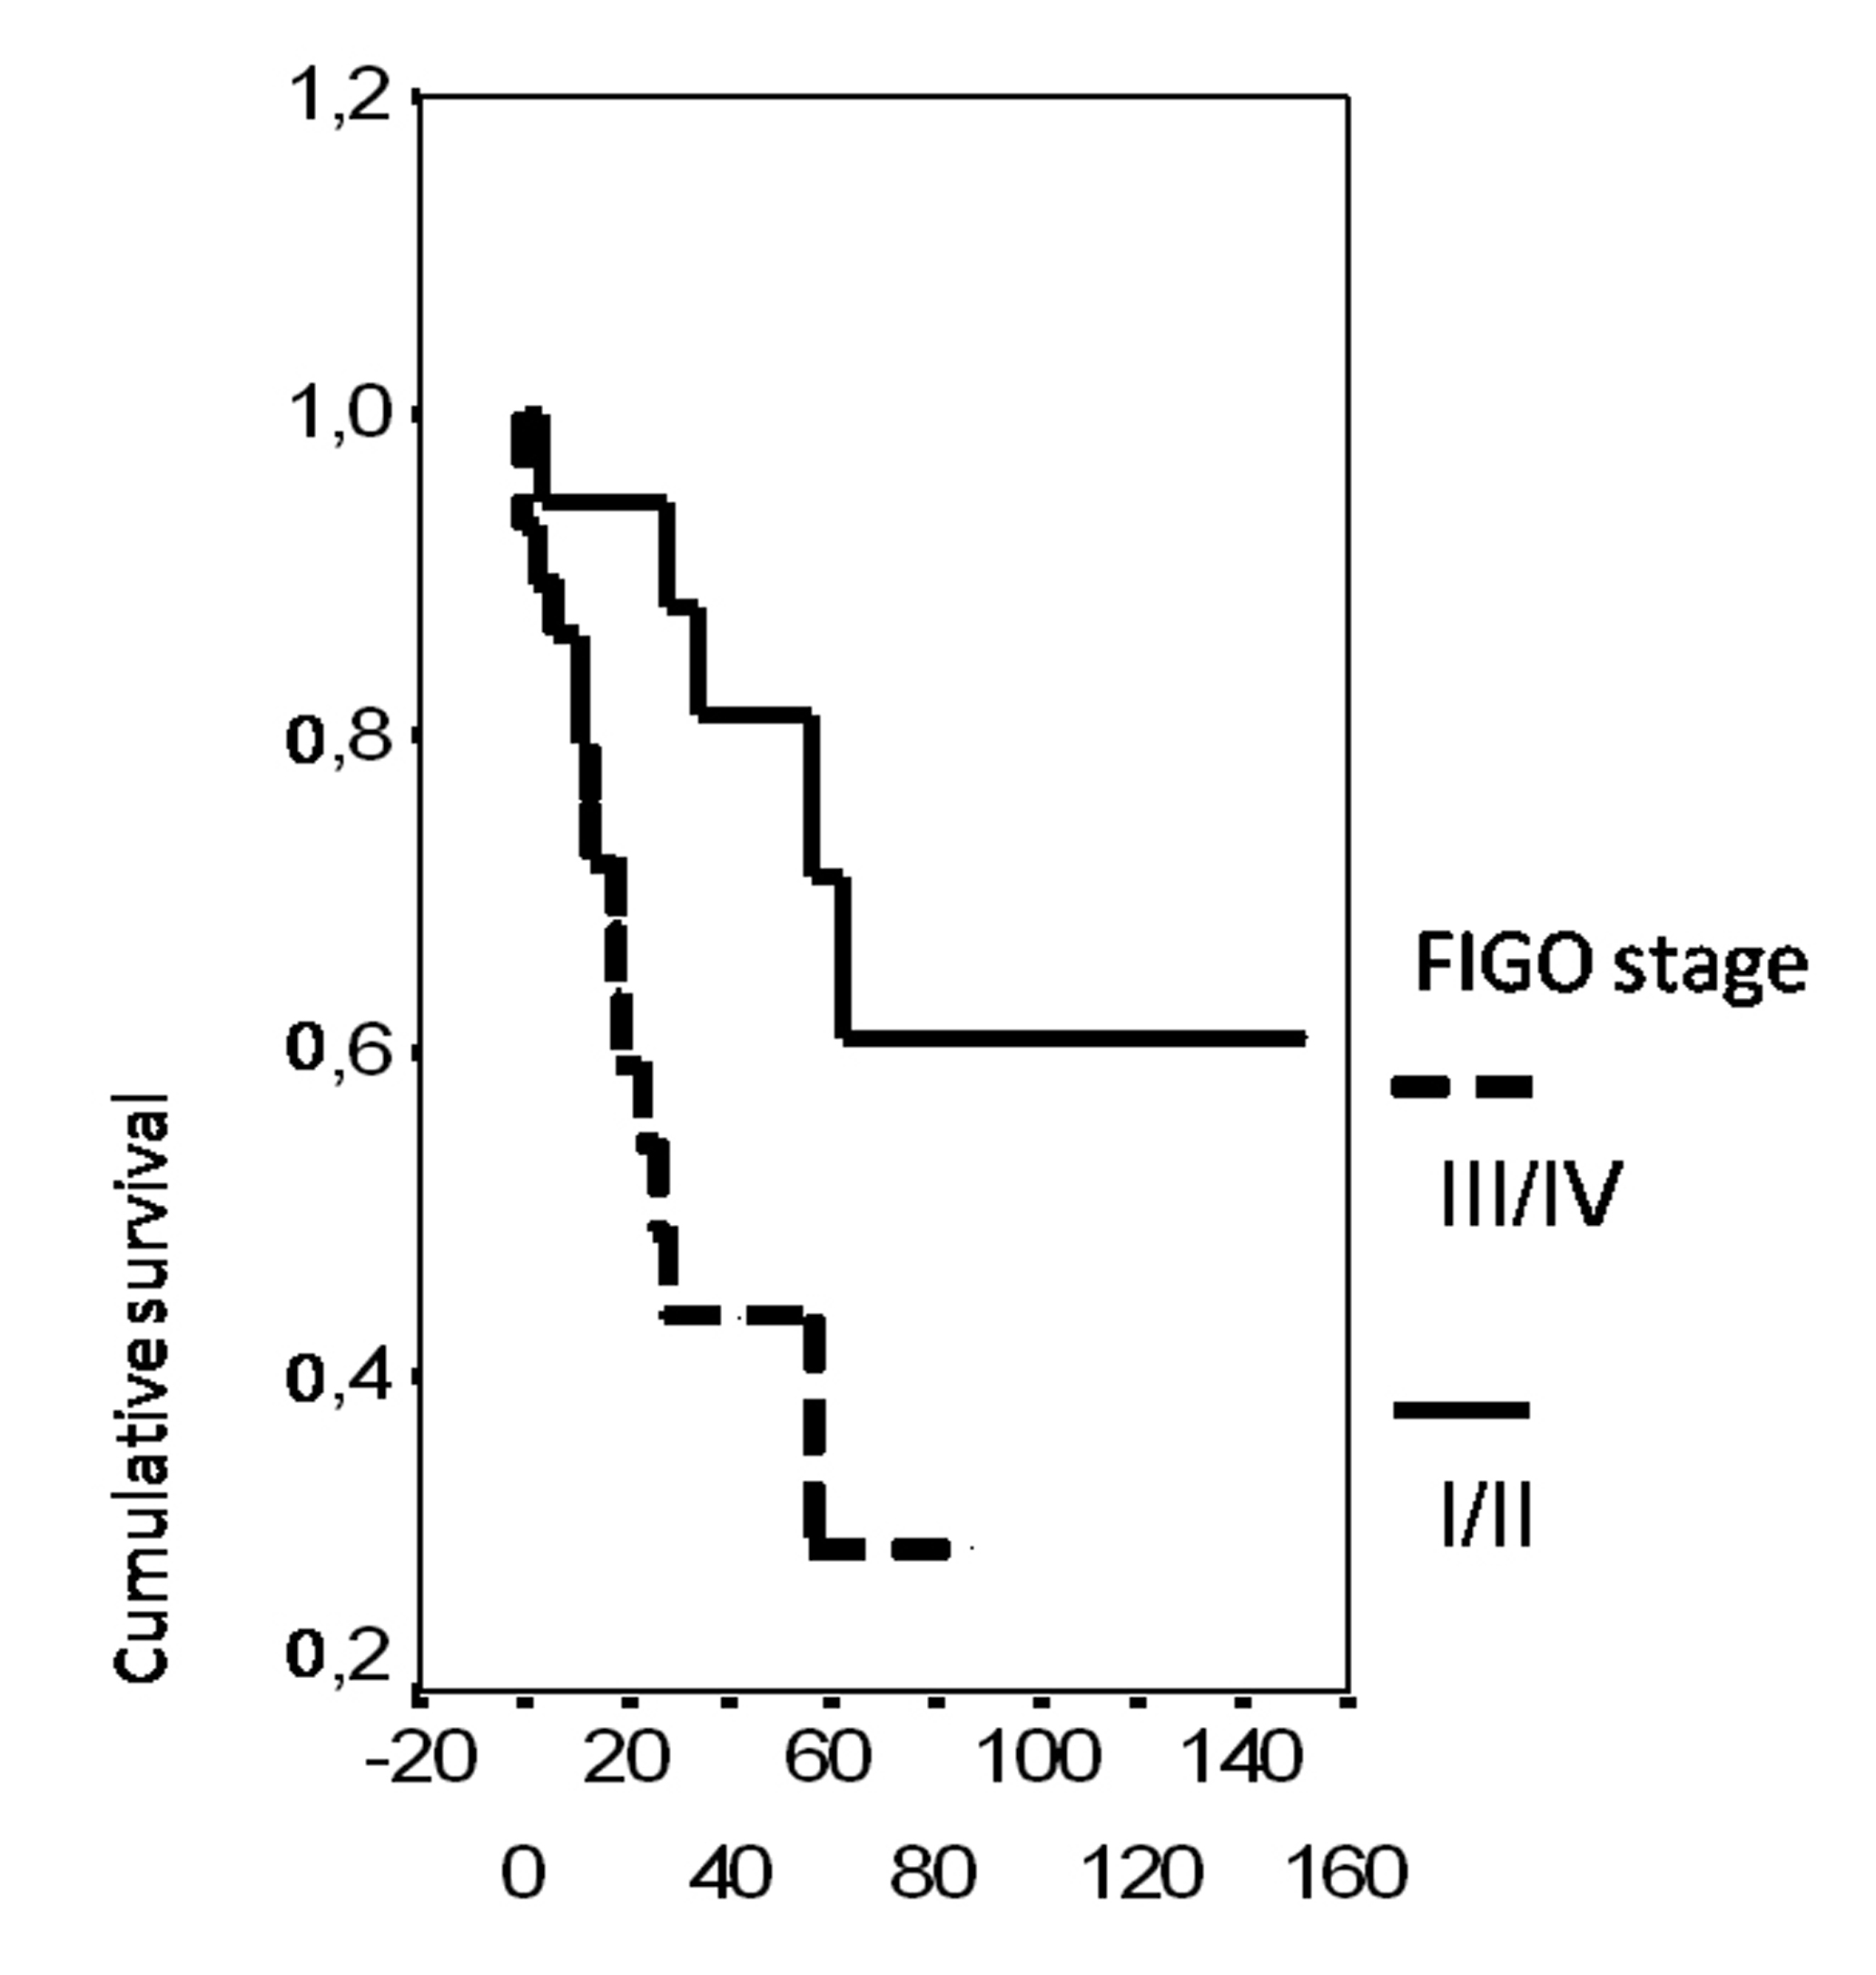
| FIGO Stage | ||
| I/II | 20 | 35.1 |
| III/IV | 37 | 64.9 |
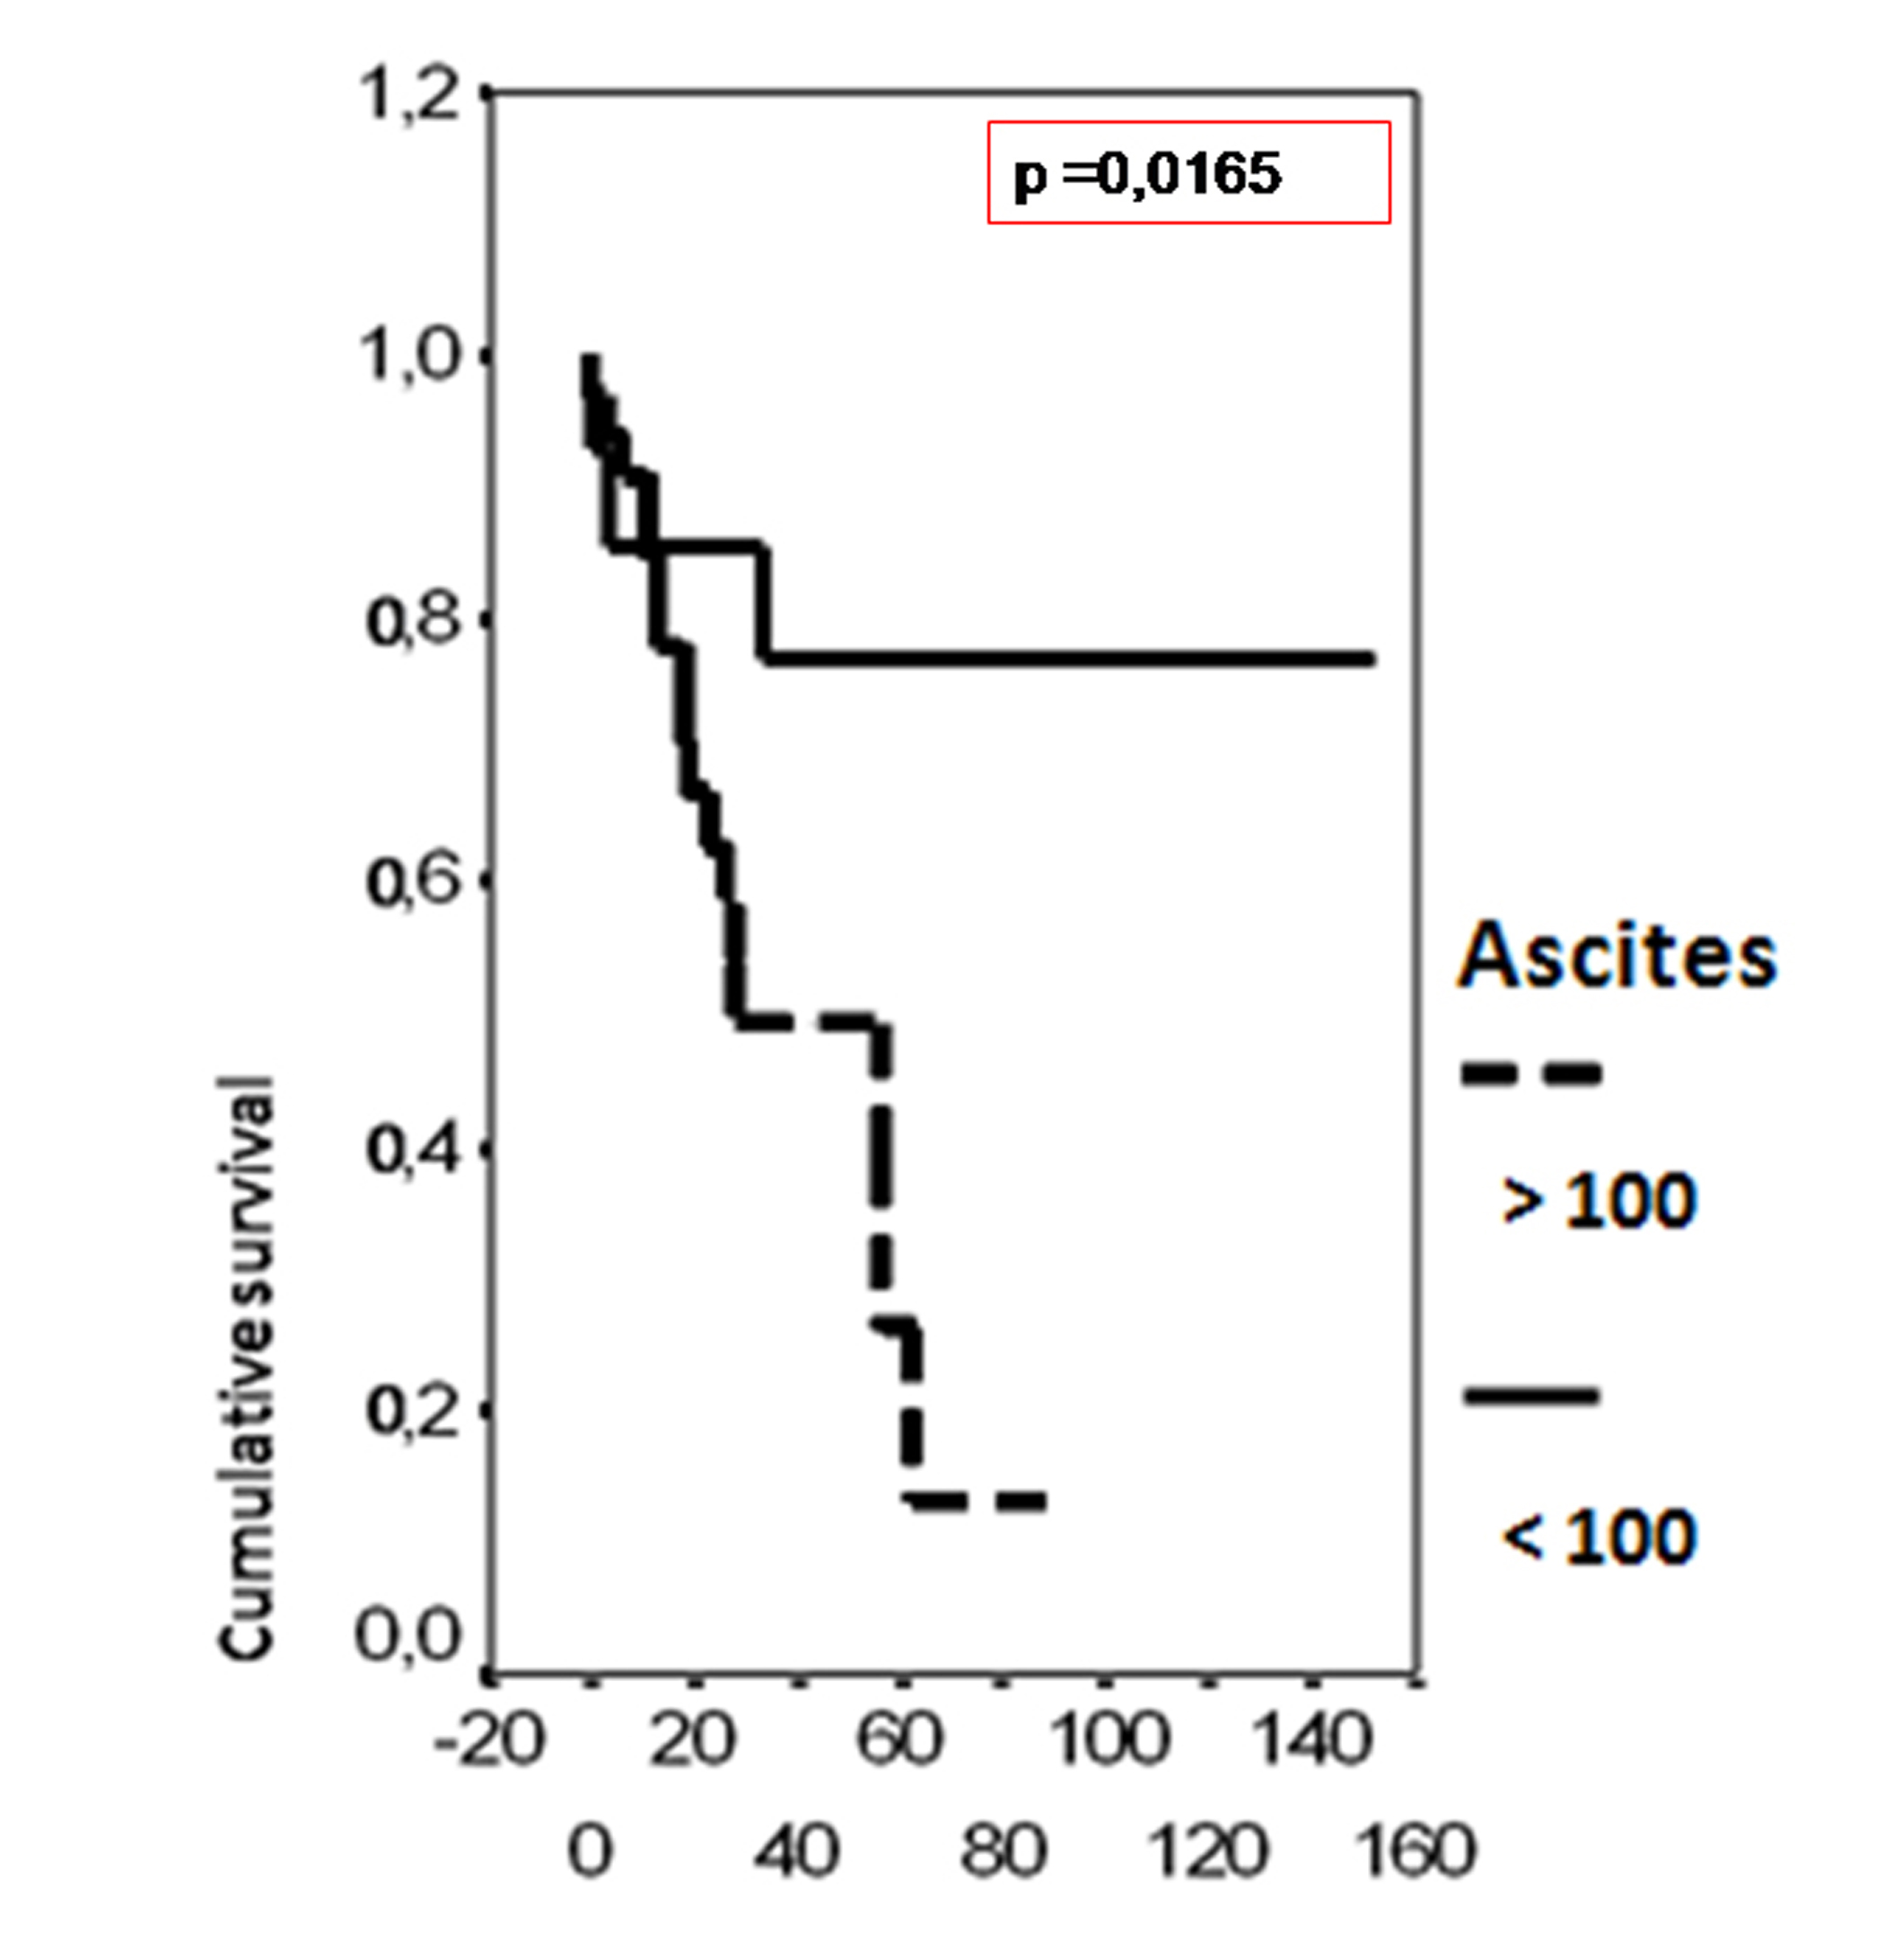
| Ascites | ||
| <100 ml | 23 | 65.2 |
| >100 ml | 34 | 79.2 |
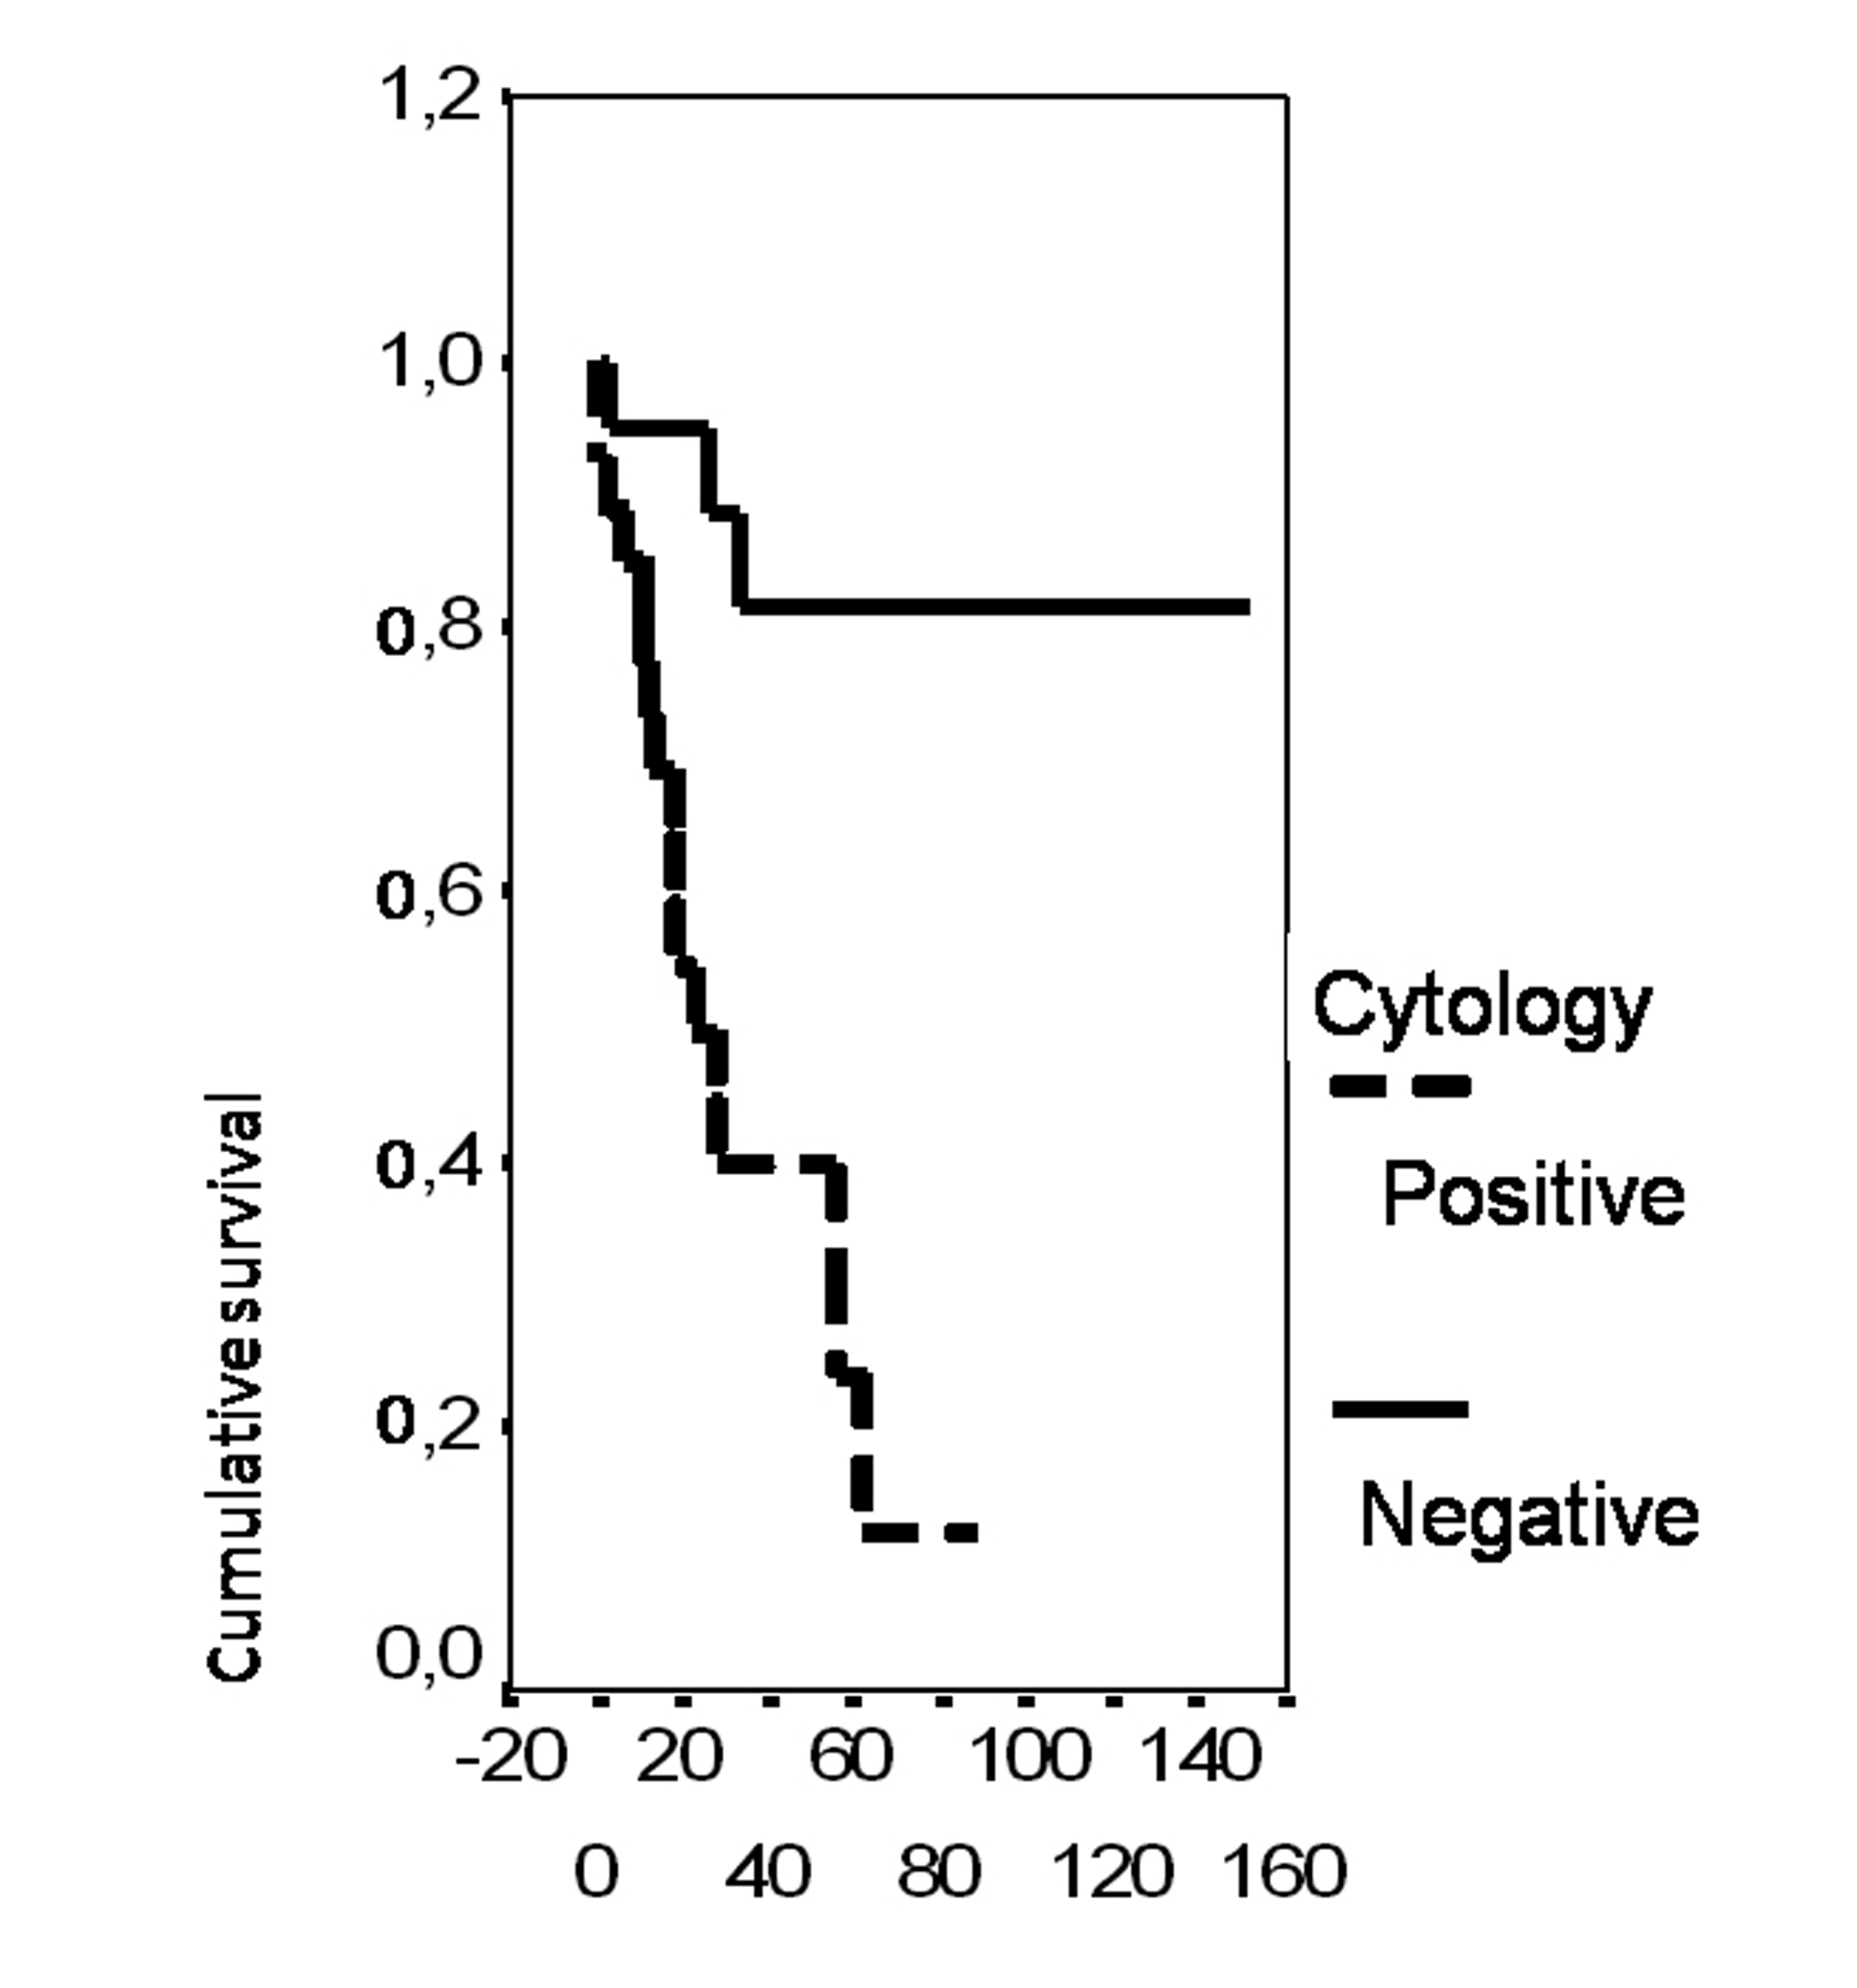
| Cytology | ||
| Negative | 28 | 71.4 |
| Positive | 29 | 75.9 |
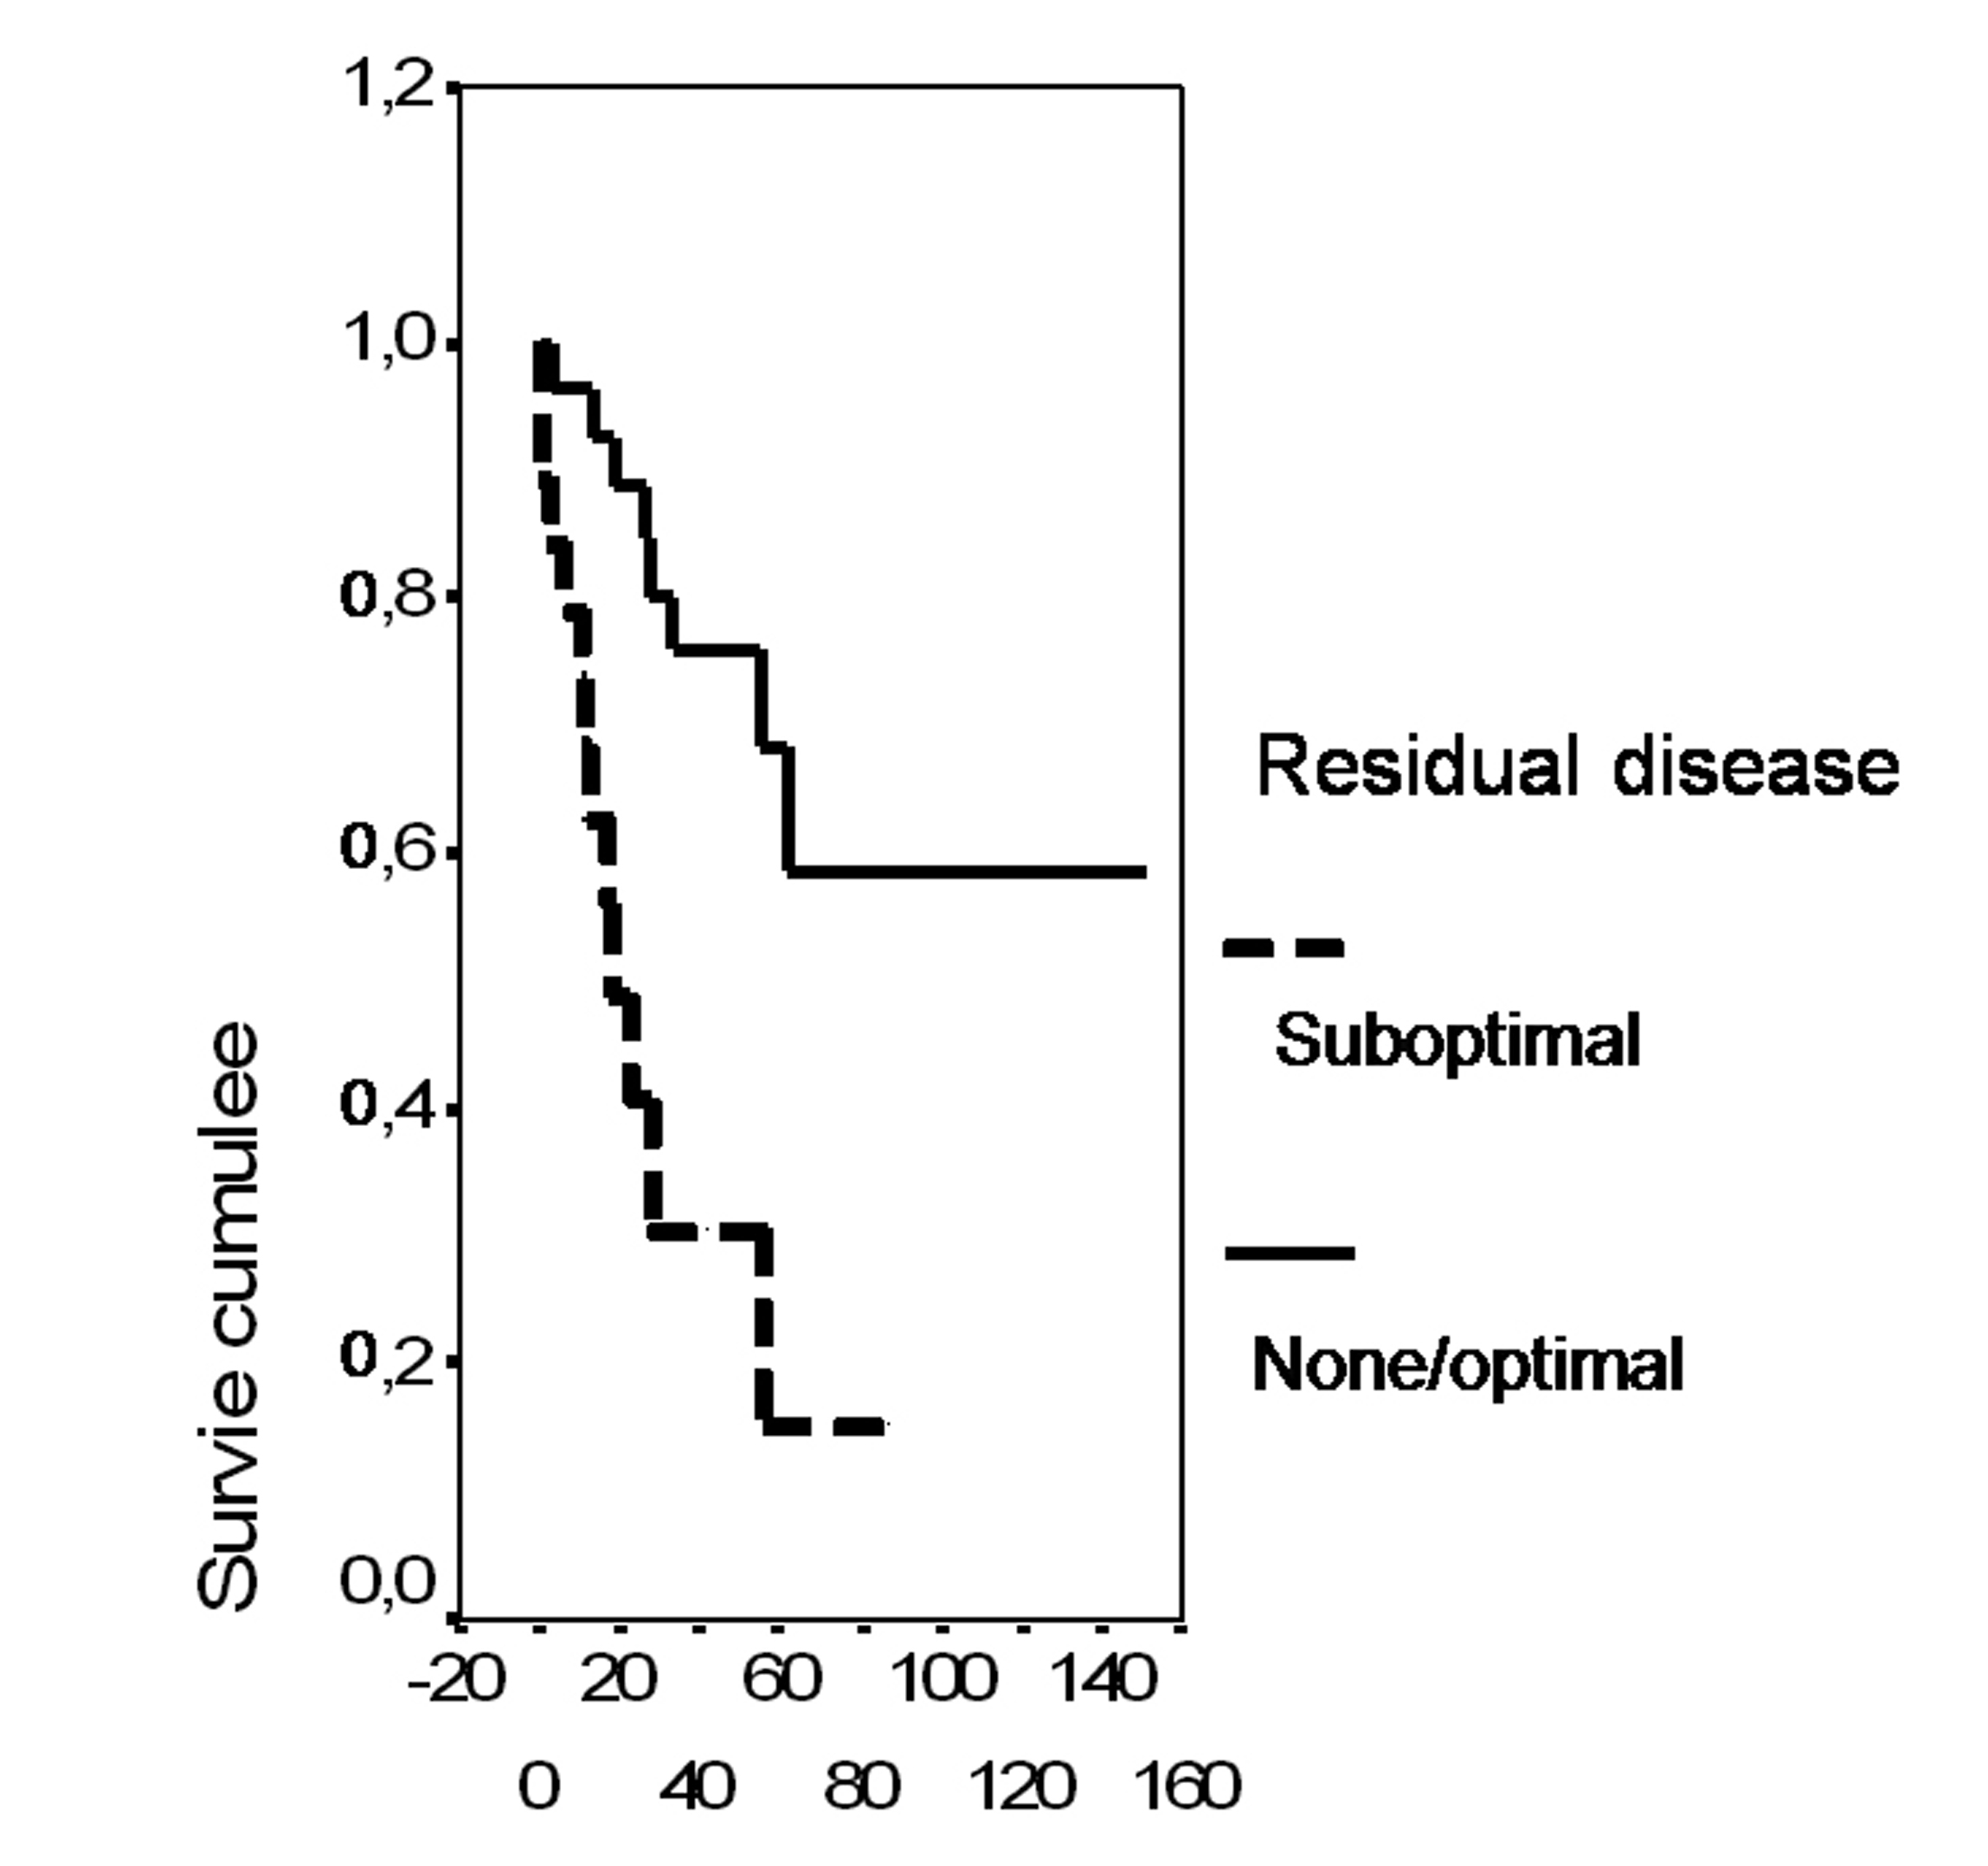
| Residual disease | ||
| None/Optimal | 31 | 54.4 |
| Suboptimal | 26 | 45.6 |
| Histologic type | ||
| Serous | 24 | 42.1 |
| Non serous | 33 | 57.9 |
| Tumor grade | ||
| I/II | 34 | 59.6 |
| III | 23 | 40.4 |
| p53 | ||
| Negative | 15 | 26.3 |
| Positive | 42 | 73.7 |
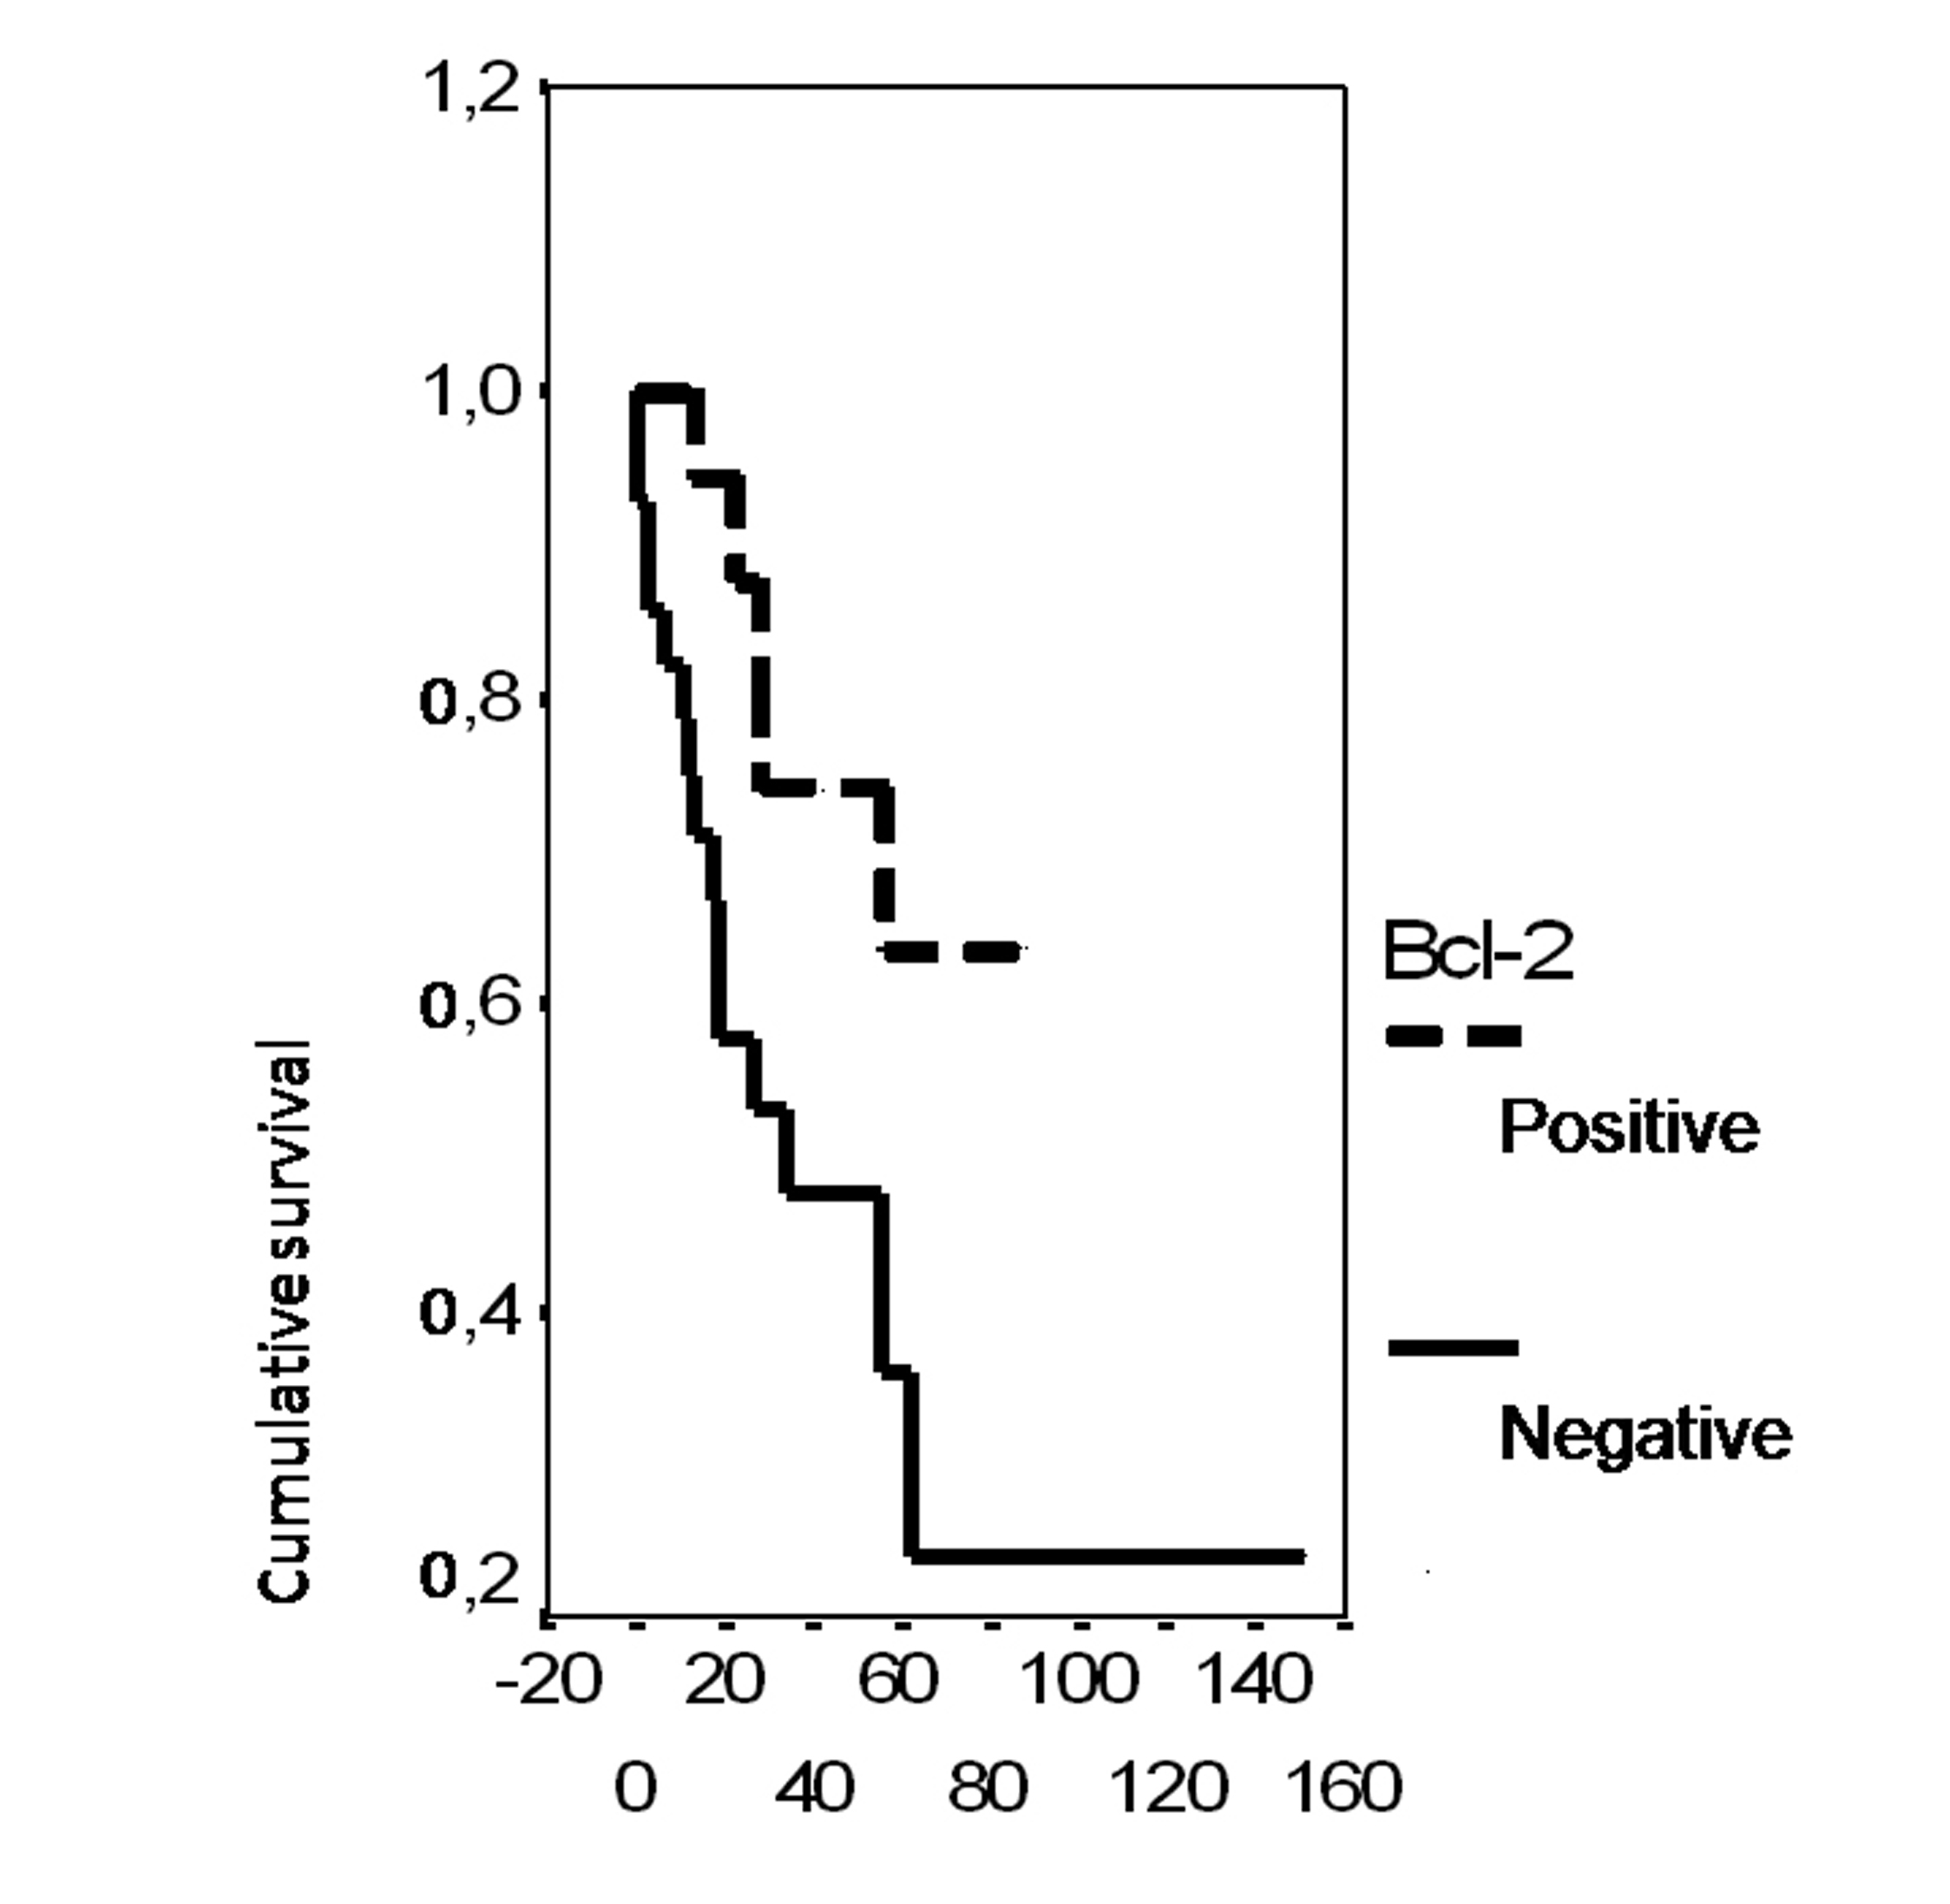
| Bcl-2 | ||
| Negative | 30 | 52.6 |
| Positive | 27 | 47.4 |
| ER | ||
| Negative | 37 | 64.9 |
| Positive | 20 | 35.1 |
| PR | ||
| Negative | 38 | 66.7 |
| Positive | 19 | 33.3 |
| Surgery | ||
| Optimal | 31 | 54.4 |
| Suboptimal | 26 | 45.6 |
| Systemic chemotherapy | ||
| Adjuvant | 45 | 96.49 |
| Neoadjuvant | 2 | 3.51 |
| Response | ||
| CPR and micro only | 28 | 49.1 |
| Partial | 2 | 3.5 |
| Stable and progression | 15 | 26.3 |
| Not assessable | 12 | 21.0 |
| Histologic subtypes | Number | % |
|---|---|---|
| Serous carcinoma | 24 | 42.1 |
| Endometrioid carcinoma | 23 | 40.3 |
| Malignant mixed epithelial tumour | 4 | 7 |
| Mucinous carcinoma | 3 | 5.3 |
| Undifferenciated carcinoma | 2 | 3.5 |
| Transitional cell carcinoma | 1 | 1.8 |
| ER | Total | ||
|---|---|---|---|
| Negative | Positive | ||
| ER: Estrogen receptor; PR: Progesterone receptor. | |||
| PR | |||
| Negative | 33 (86.8%) | 5 (13.2%) | 38 |
| Positive | 4 (21.1%) | 15 (78.9%) | 19 |
| Total | 37 | 20 | 57 |
| p53 | Total | ||
|---|---|---|---|
| Negative | Positive | ||
| Bcl-2 | |||
| Negative | 8 (26.7%) | 22 (73.3%) | 30 |
| Positive | 7 (25.9%) | 20 (74.1%) | 27 |
| Total | 15 | 42 | 57 |
| N | P53 Expression | Bcl-2 Expression | |||||||
|---|---|---|---|---|---|---|---|---|---|
| % | p1 | Score ± SD | p2 | % | p1 | Score ± SD | p2 | ||
| p1: Chi-Square test; p2: Student test; %: Positivity percentage; SD: standard deviation. | |||||||||
| Age (years) | 0.611 | 0.372 | 0.153 | 0.230 | |||||
| ≤ 55 | 31 | 71 | 3.23 ± 3.48 | 38.7 | 0. 84 ± 1.65 | ||||
| >55 | 26 | 76.9 | 4.08 ± 3.64 | 57.7 | 1.42 ± 1.98 | ||||
| FIGO Stage | 0.085 | 0.026 | 0.169 | 0.893 | |||||
| I-II | 20 | 60 | 2.20 ± 3.25 | 35 | 1.15 ± 2.27 | ||||
| III-IV | 37 | 81.5 | 4.38 ± 3.50 | 54.1 | 1.08 ± 1.55 | ||||
| Residual disease | 0.611 | 0.135 | 0.716 | 0.970 | |||||
| None/Optimal | 31 | 71 | 2.97 ± 3.33 | 45.2 | 1.1 ± 1.98 | ||||
| Sub-optimal | 26 | 76.9 | 4.38 ± 3.71 | 50 | 1.12 ± 1.63 | ||||
| Histologic type | 0.847 | 0.320 | 0.462 | 0.271 | |||||
| Serous | 24 | 75 | 4.17 ± 3.66 | 41.7 | 0.79 ± 1.35 | ||||
| No Serous | 33 | 72.7 | 3.21 ± 3.46 | 51.5 | 1.33 ± 2.08 | ||||
| Histologic Grade | 0.061 | 0.063 | 0.629 | 0.636 | |||||
| I-II | 34 | 64.7 | 1.65 ± 0.48 | 50 | 1.50 ± 0.50 | ||||
| III | 23 | 87 | 1.87 ± 0.34 | 43.5 | 1.43 ± 0.50 | ||||
| Ascites | |||||||||
| <100 ml | 23 | 65.2 | 0.230 | 3.35 ± 3.74 | 0.646 | 39.1 | 0.306 | 0.83 ± 1.58 | 0.345 |
| >100 ml | 34 | 79.2 | 3.79 ± 3.45 | 52.9 | 1.29 ± 1.96 | ||||
| Cytology | 0.452 | 0.503 | 0.892 | ||||||
| negative | 28 | 71.4 | 0.700 | 3.25 ± 3.58 | 42.9 | 1.07 ± 1.96 | |||
| positive | 29 | 75.9 | 3.97 ± 3.54 | 51.7 | 1.14 ± 1.70 | ||||
| N | ER Expression | PR Expression | |||||||
|---|---|---|---|---|---|---|---|---|---|
| % | p1 | Score ± SD | p2 | % | p1 | Score ± SD | p2 | ||
| p1: Chi-Square test; p2: Student test; %: positivity percentage; ER: Estrogen receptor; PR: Progesterone receptor; SD: standard deviation. | |||||||||
| Age (years) | 0.296 | 0.614 | 0.707 | 0.537 | |||||
| ≤ 55 | 31 | 29 | 1.06 ± 2.30 | 35.5 | 1.87 ± 3.05 | ||||
| >55 | 26 | 42.3 | 1.38 ± 2.45 | 30.8 | 1.38 ± 2.80 | ||||
| FIGO Stage | 0.568 | 0.105 | 0.170 | 0.045 | |||||
| I-II | 20 | 40 | 1.90 ± 3.38 | 45 | 2.70 ± 3.68 | ||||
| III-IV | 37 | 32.4 | 0.84 ± 1.48 | 27 | 1.08 ± 2.27 | ||||
| Residual disease | 0.945 | 0.289 | 0.039 | 0.013 | |||||
| None/Optimal | 31 | 35.5 | 1.52 ± 2.89 | 45.2 | 2.52 ± 3.45 | ||||
| Sub-optimal | 26 | 34.6 | 0.85 ± 1.46 | 19.2 | 0.62 ± 1.67 | ||||
| Histologic type | 0.813 | 0.570 | 0.088 | 0.010 | |||||
| Serous | 24 | 33.3 | 1.00 ± 1.64 | 20.8 | 0.50 ± 1.06 | ||||
| No Serous | 33 | 36.4 | 1.36 ± 2.78 | 42.4 | 2.48 ± 3.52 | ||||
| Histologic Grade | 0.021 | 0.021 | 0.036 | 0.036 | |||||
| I-II | 34 | 47.1 | 1.47 ± 0.50 | 44.1 | 1.44 ± 0.50 | ||||
| III | 23 | 17.4 | 1.17 ± 0.38 | 17.4 | 1.17 ± 0.38 | ||||
| Ascites | 0.599 | 0.986 | 0.84 | 0.933 | |||||
| <100 ml | 23 | 39.1 | 1.22 ± 1.70 | 34.8 | 1.61 ± 2.72 | ||||
| >100 ml | 34 | 32.4 | 1.21 ± 2.73 | 32.4 | 1.68 ± 3.09 | ||||
| Cytology | 0.70 | 0.90 | 0.134 | 0.182 | |||||
| Negative | 28 | 71.4 | 1.75 ± 3.02 | 42.9 | 2.18 ± 3.19 | ||||
| Positive | 29 | 75.9 | 0.69 ± 1.31 | 24.1 | 1.14 ± 2.58 | ||||