Figures
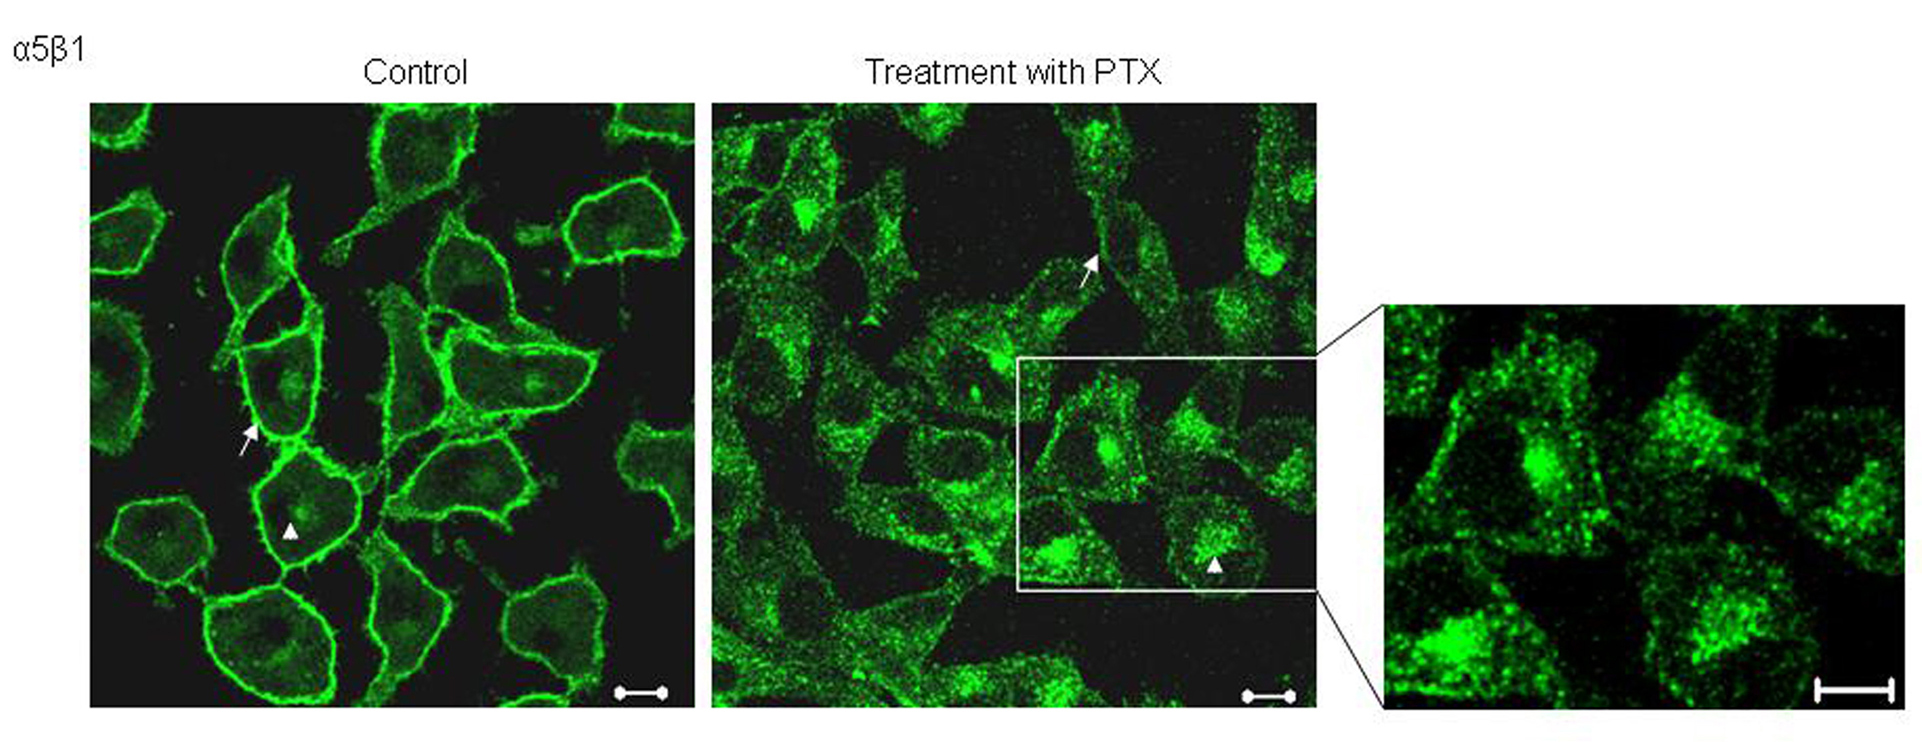
Figure 1. Effect of PTX on the localization of α5 integrins. Untreated and PTX treated cells, fixed and probed with an antibody against α5 integrins and visualized by FITC conjugated secondary antibody. Representative images are shown here. Scale bar, 10 µm.
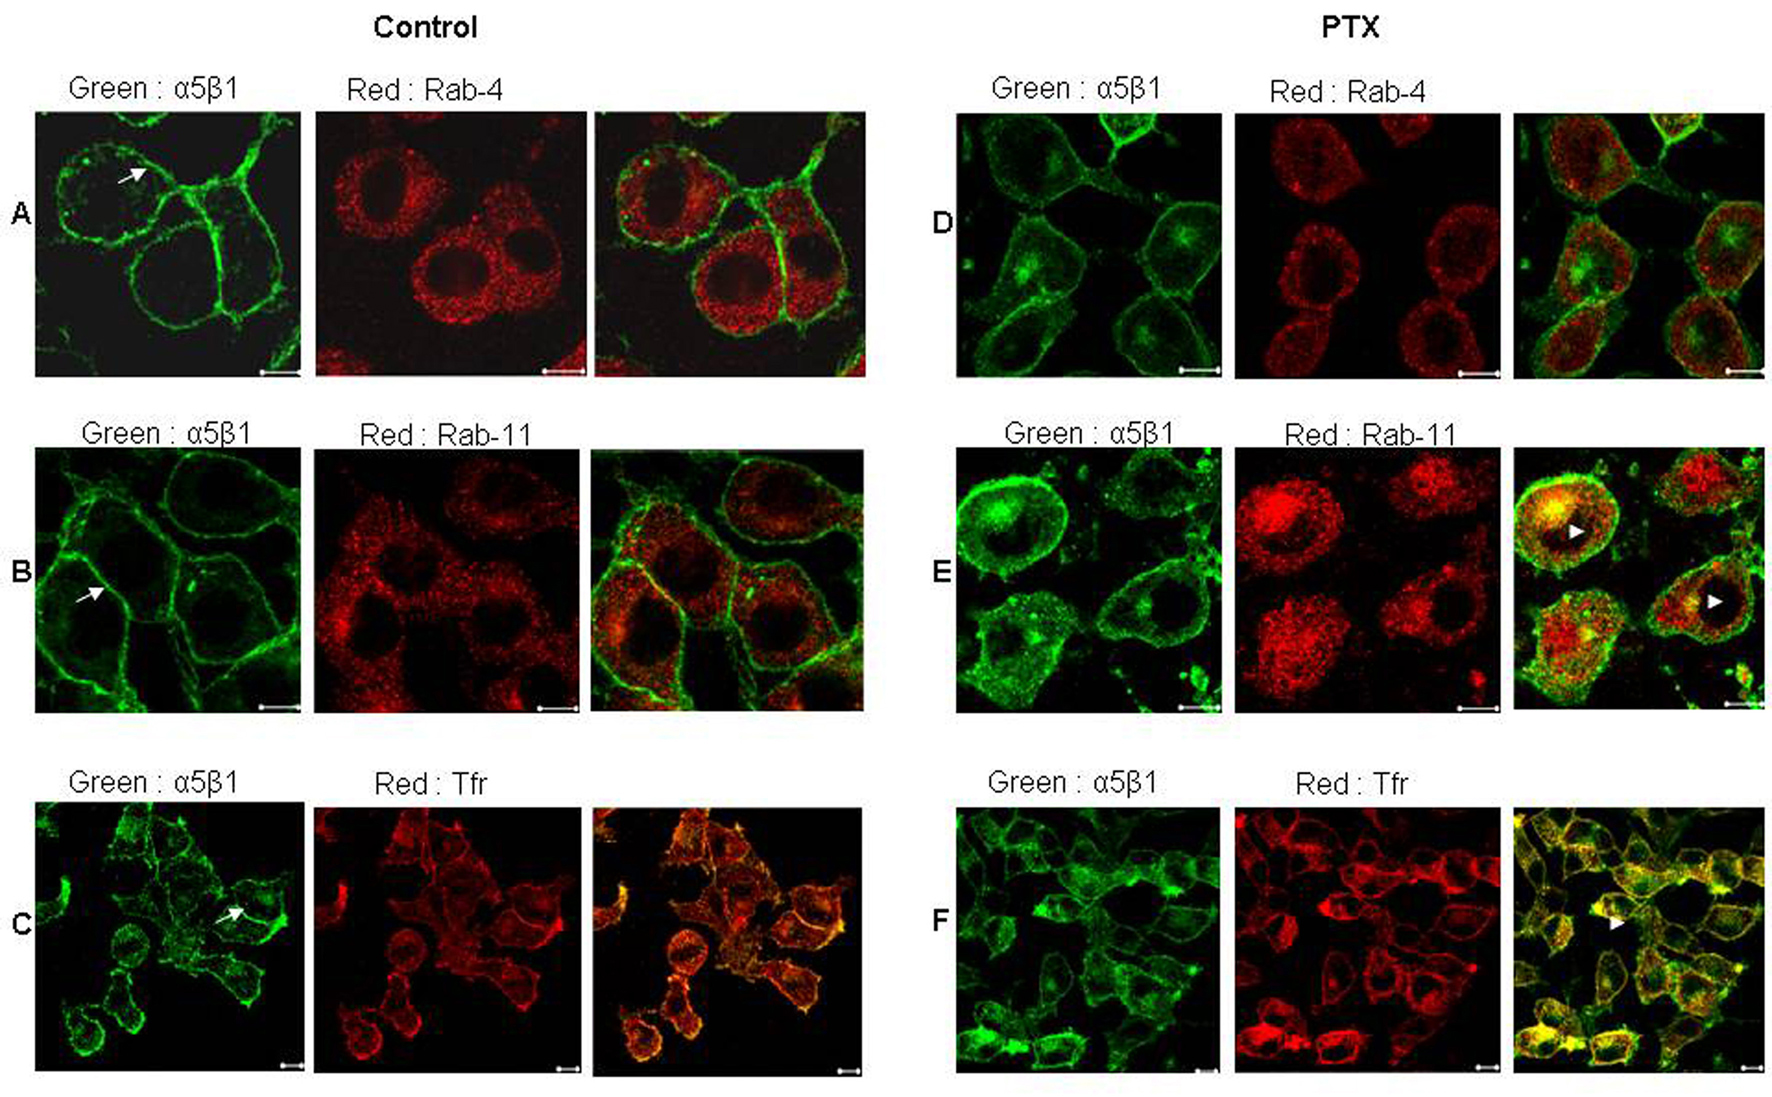
Figure 2. Post PTX treatment α5 integrins colocalized with Transferrin receptor and Rab 11 GTPase. Control (A, B and C) and PTX (D, E and F) treated F10 cells stained for α5 integrins (Green) and Rab 4 GTPase (A and D), Rab 11 GTPase (B and E) and Transferrin receptor (C and F) in Red. Yellow indicates colocalization of the two flurophores. Representative images are shown here. Scale bar, 10µm.
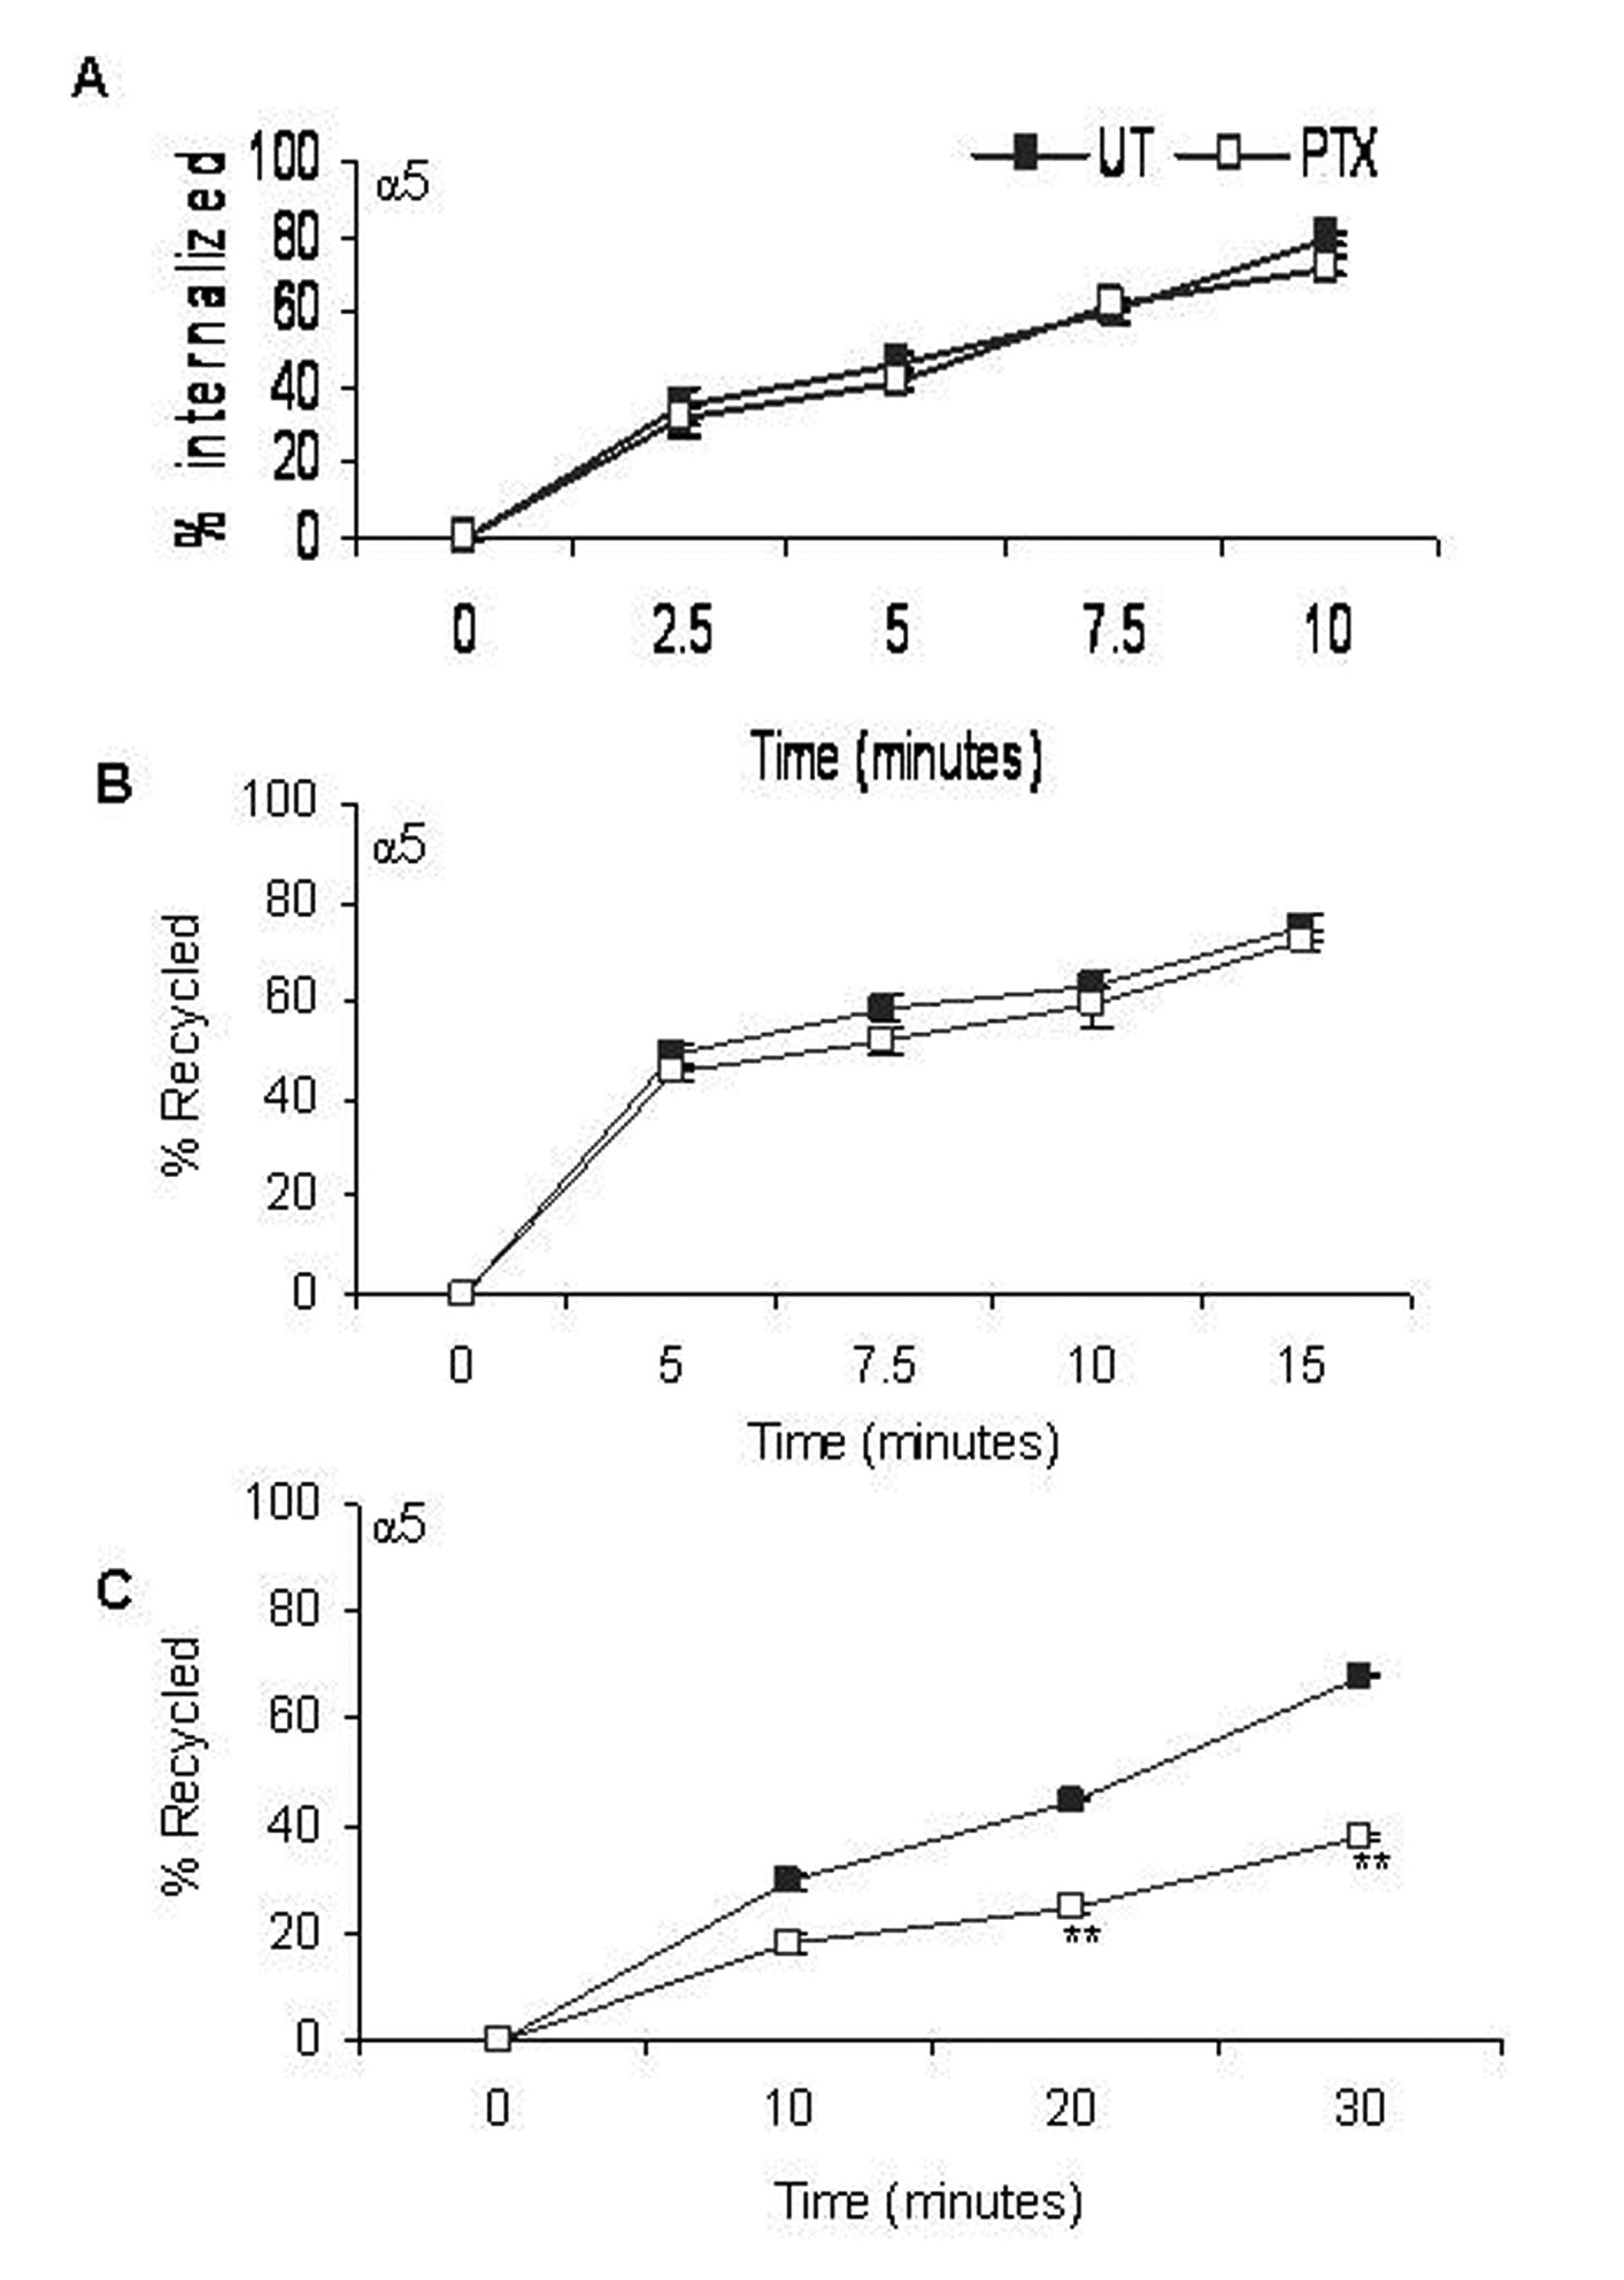
Figure 3. Effect of PTX on rates of α5 integrin distribution /redistribution. Rates of internalization (A), recycling from early endosomes (B) and recycling from perinuclear endosomes (C) of α5 integrins were measured. Closed squares represent rates of integrin transport in untreated cells and open squares represent that of PTX treated cells. Results represent the mean ± s.e.m of three independent experiments. **P < 0.01 vs untreated control (Students t-test).
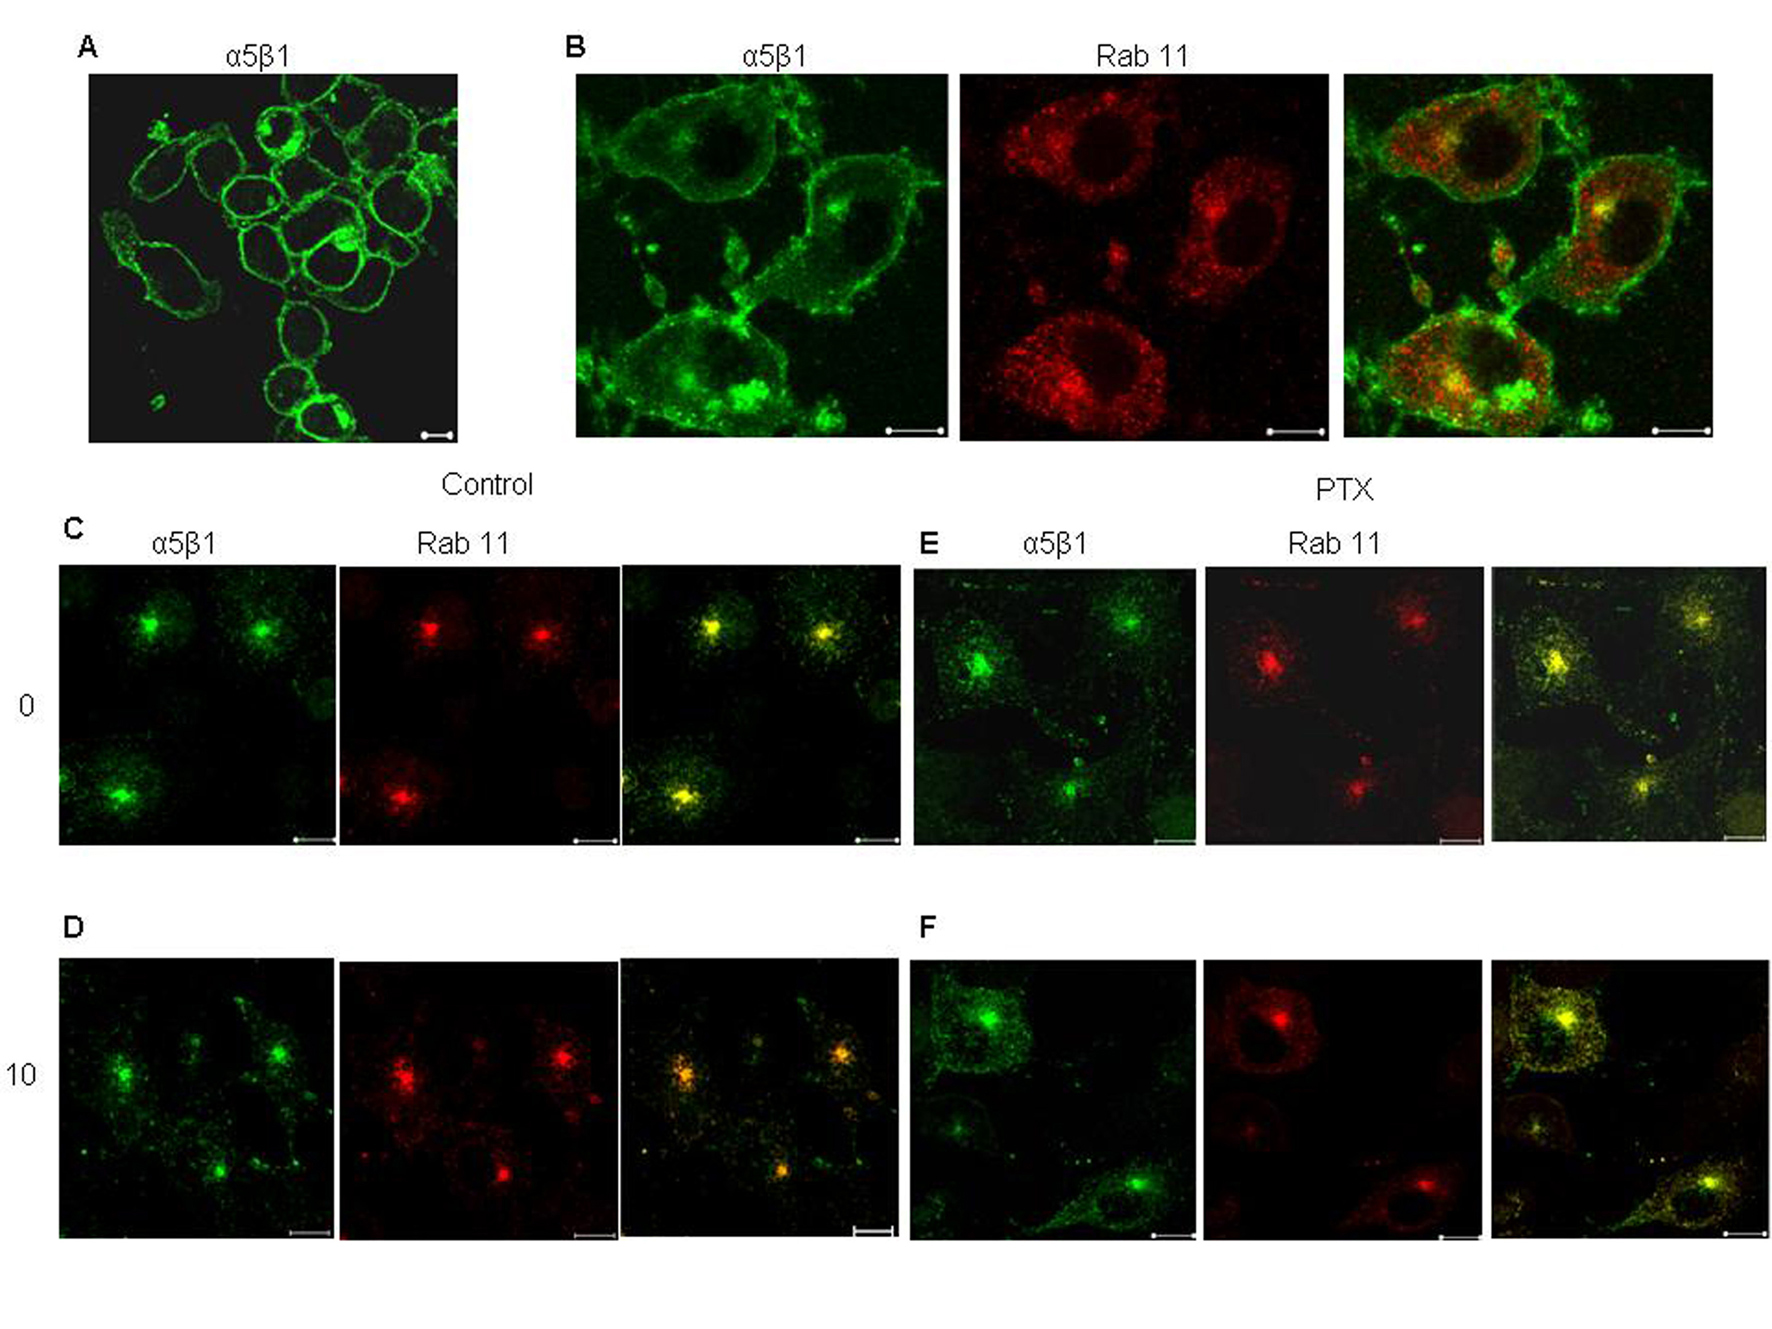
Figure 4. Effect of PTX on recycling of α5 integrin from perinuclear recycling endosomes. Surface α5β1 integrins, labeled with anti mouse α5 integrin antibody for 30 minutes at 4°C (A), allowed to internalize at 37°C for 30 minutes (B. The antibody remaining on the surface was stripped off (C and E, 0 minutes) and the internalized fraction was allowed to recycle by incubation at 37°C 10 minutes (D and F). Yellow indicates colocalization of the two flurophores. Representative images are shown here. Scale bar, 10 µm.
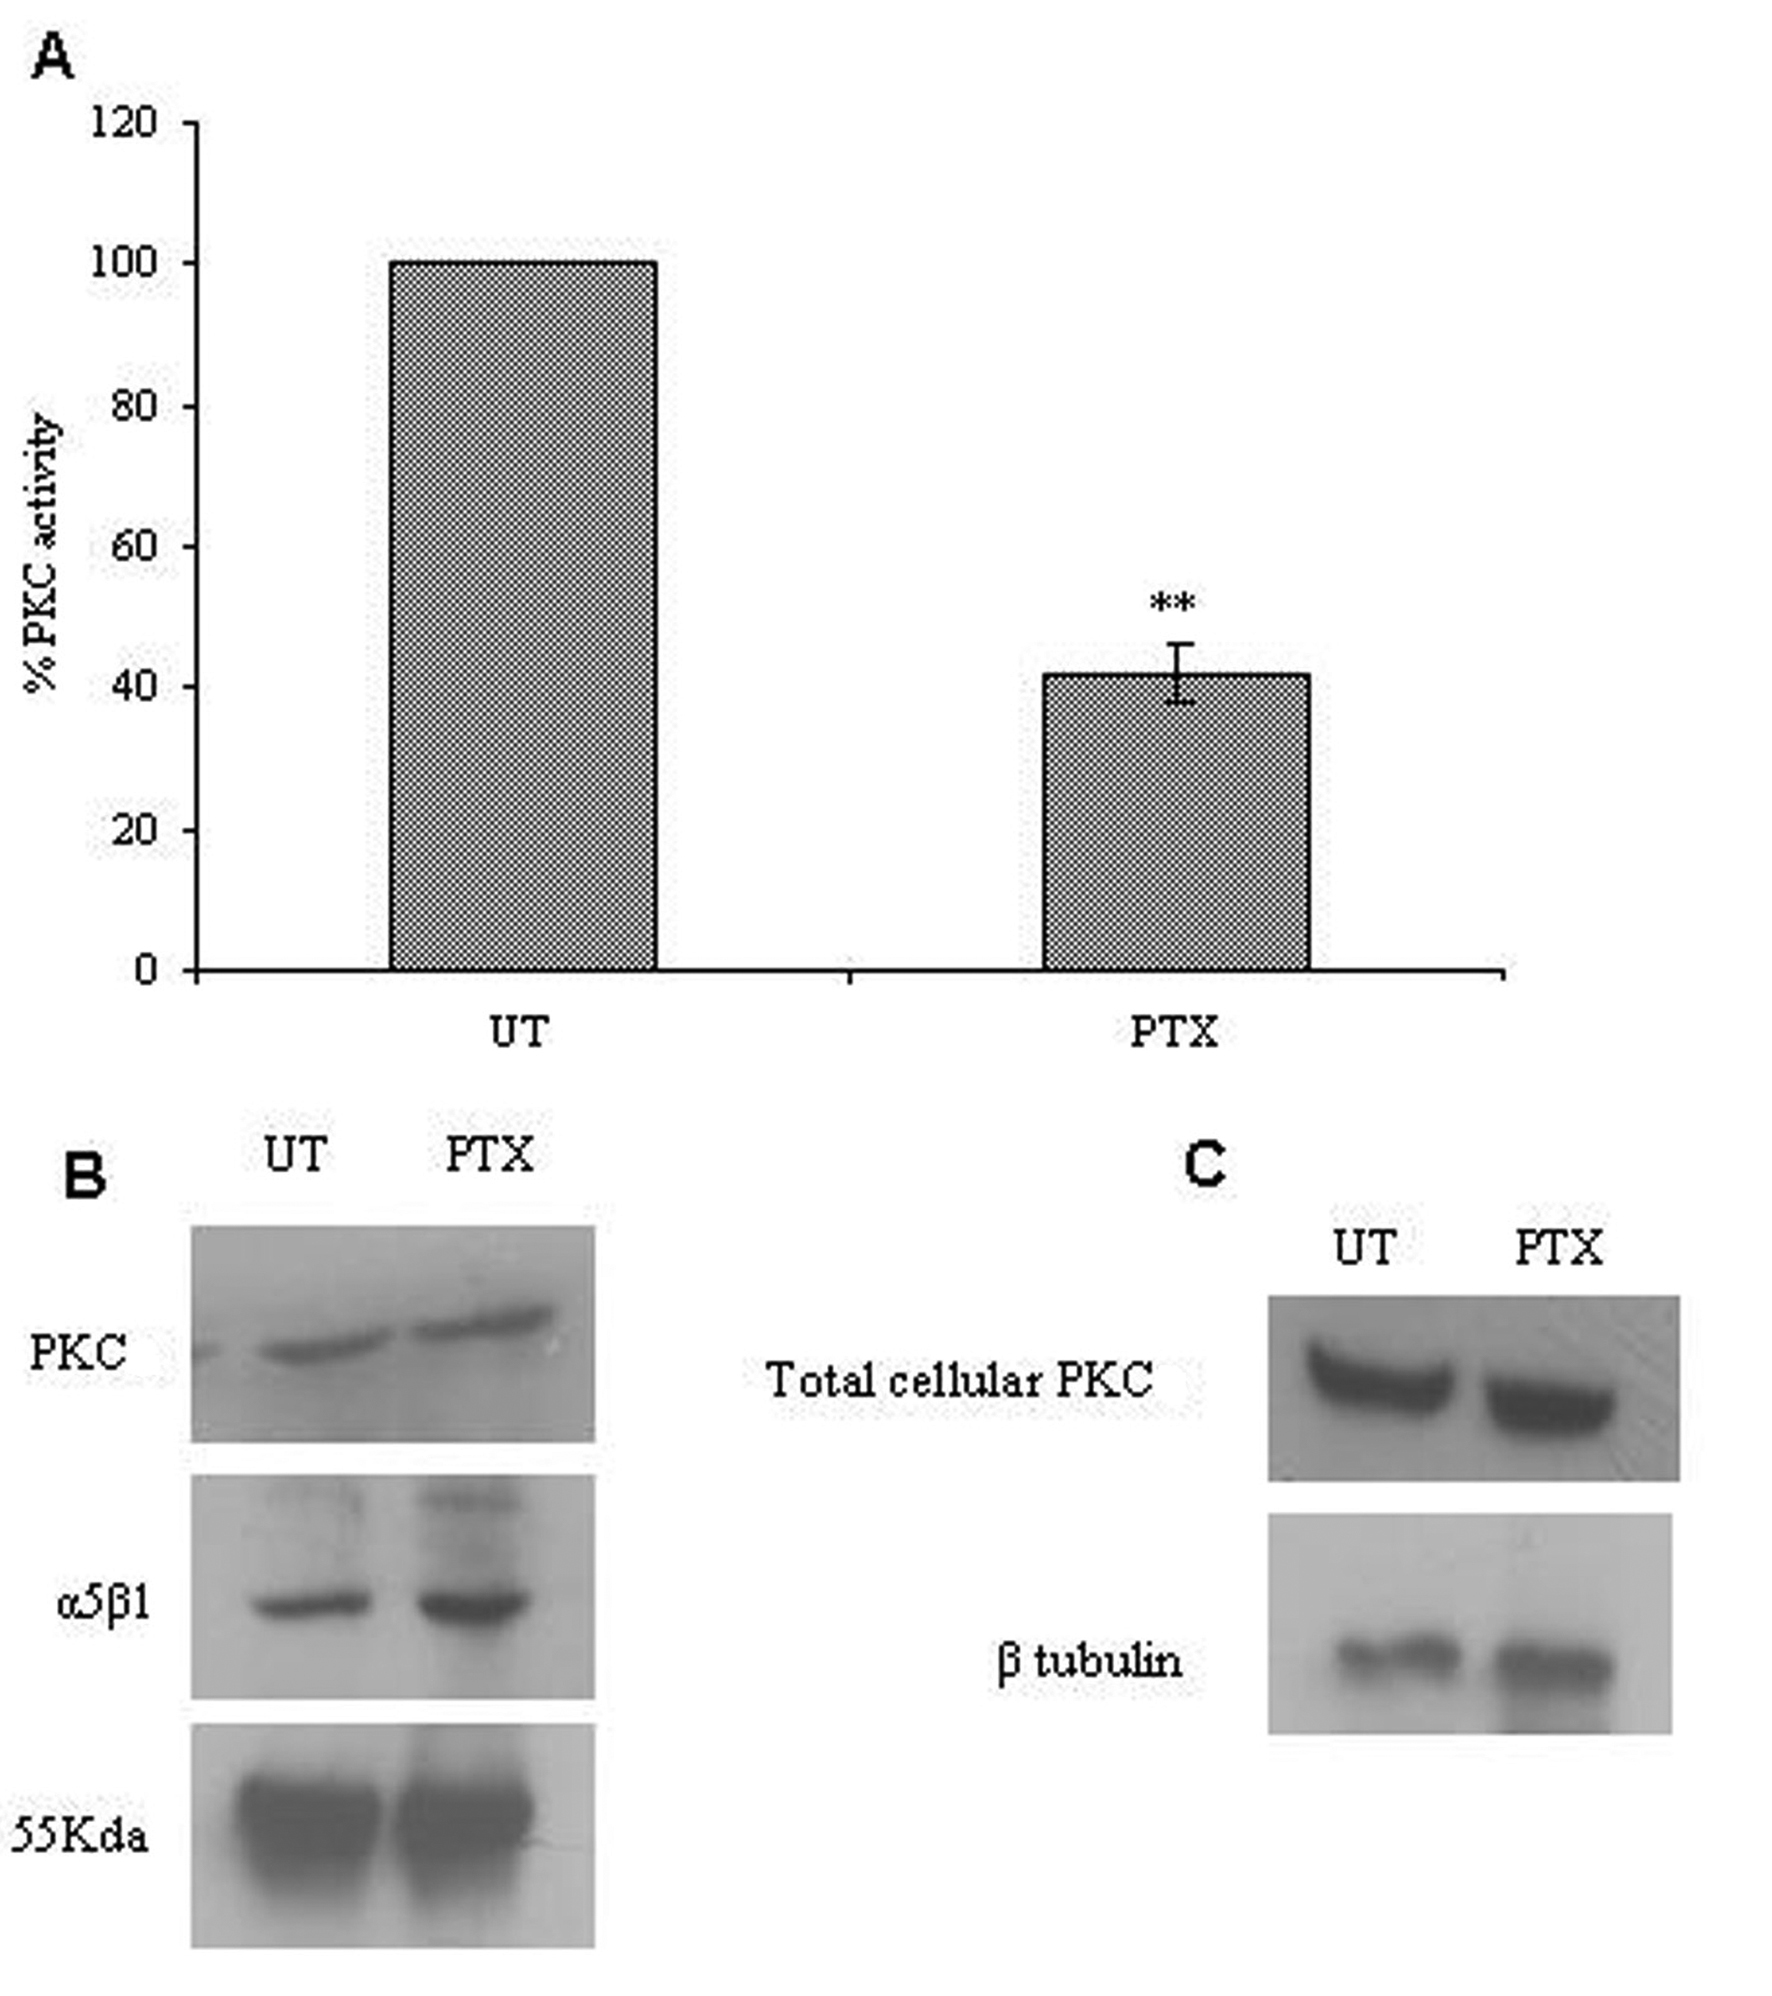
Figure 5. Effect of PTX on integrin associated PKC expression and activity. The α5β1 integrin was immunoprecipitated from control and PTX treated cells, and used to assay for integrin associated PKC activity (A) or analyzed for the presence of α5β1 integrins and PKC by western blotting (B). Western blotting was done for PKC in total cell lysates obtained from control and PTX treated cells (C). The experiment was repeated thrice and representative images are shown here. Graph A represent the mean ± s.e.m of three independent experiments. **P < 0.01 vs untreated control (Students t-test).
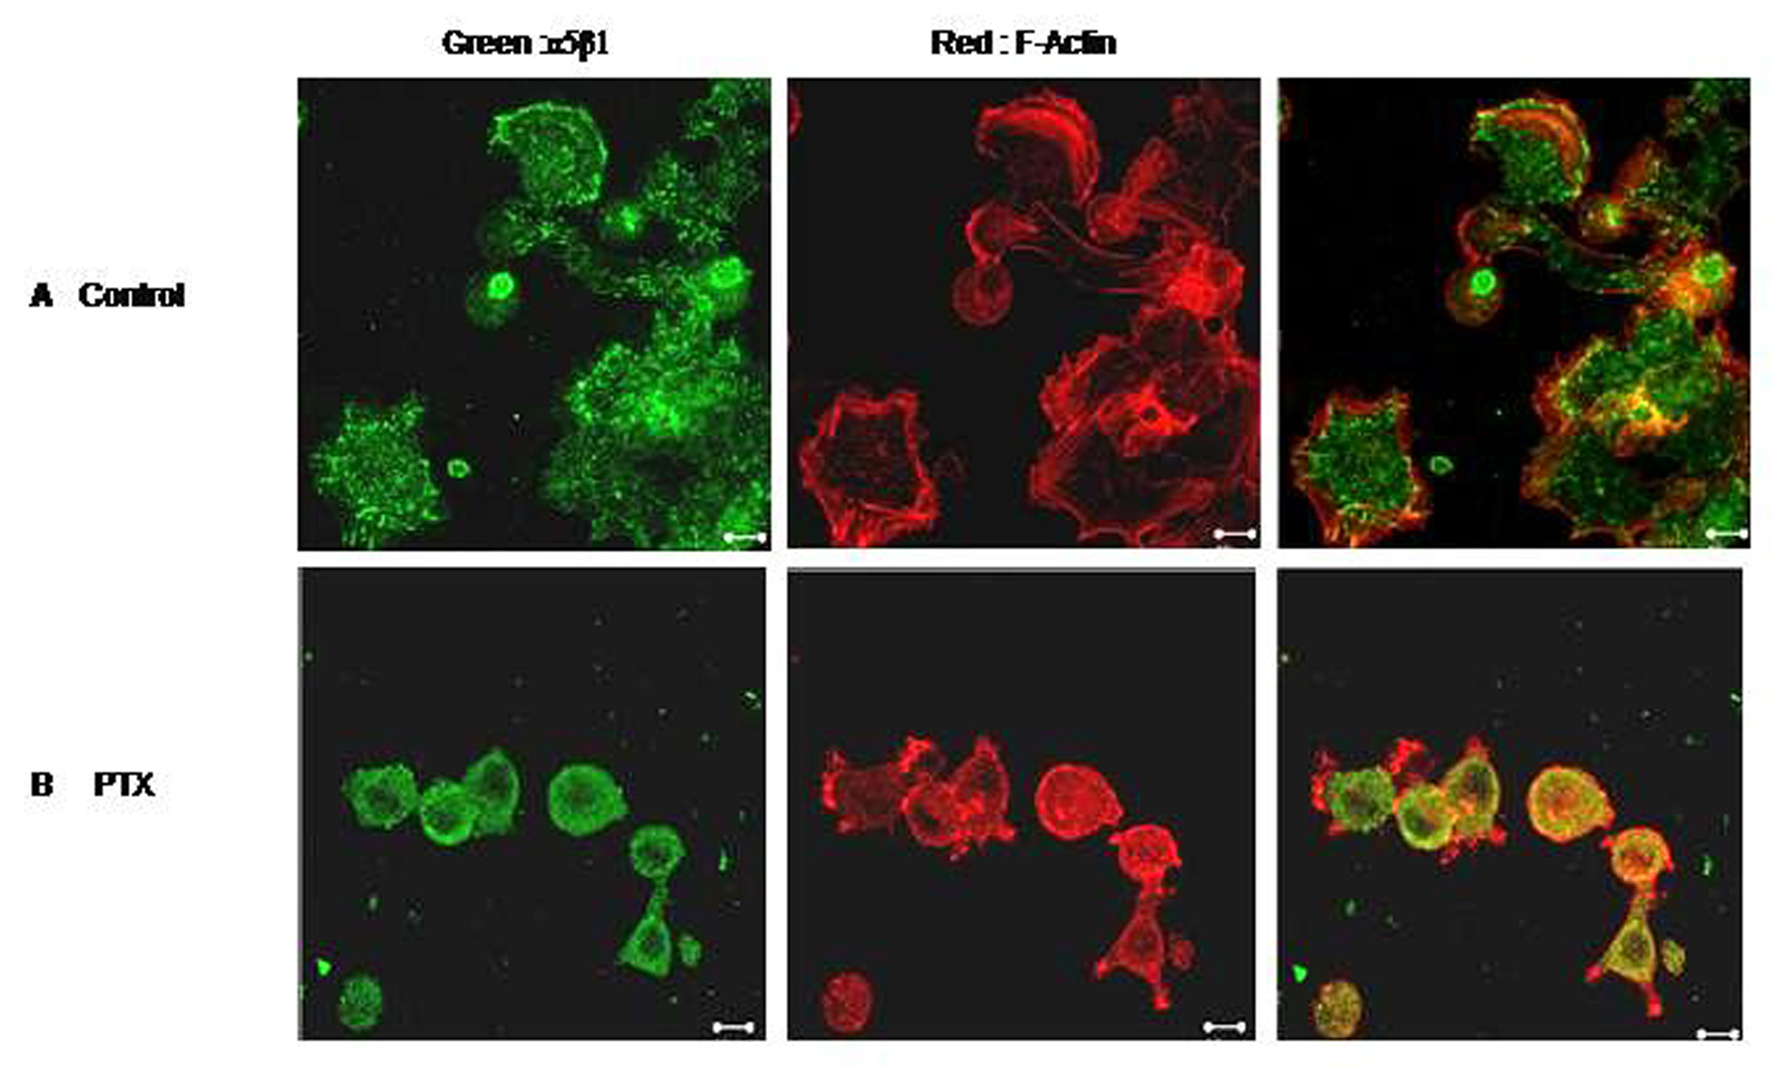
Figure 6. Effect of PTX on cell spreading. F10 cells were allowed to spread on Fibronectin coated plates in the presence or absence of Pentoxifylline. Control (A) and PTX treated (B) cells were then fixed, permeabilised and stained for F-Actin (red) and α5 integrin (green). Representative images are shown here. Scale bar, 10 µm.
Table
Table 1. Average Overlap Coefficients According to Manders Before and After PTX Treatment, Including Colocalization of α5 Integrin With Rab-4, Rab-11 and Transferring Receptor
| Control | PTX |
|---|
| α5 integrin/Rab-4 | 0.4 ± 0.228 | 0.52 ± 0.671 |
| α5 integrin/Rab-11 | 0.5 ± 0.864 | 0.87 ± 0.72 |
| α5 integrin/Transferring receptor | 0.67 ± 0.023 | 0.91 ± 0.024 |