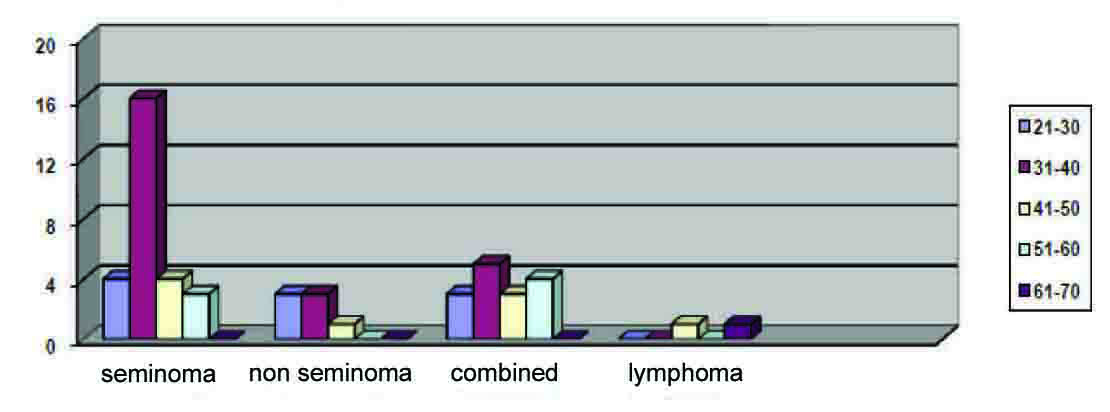
Figure 1. Tumor histology/age distribution.
| World Journal of Oncology, ISSN 1920-4531 print, 1920-454X online, Open Access |
| Article copyright, the authors; Journal compilation copyright, World J Oncol and Elmer Press Inc |
| Journal website http://www.wjon.org |
Original Article
Volume 2, Number 3, June 2011, pages 94-101
A Review in Management of Testicular Cancer: Single Center Review
Figure
Tables
| Generation | No. of cases | Person-years at risk | Age-specific incidence (per 105 years) | Standard European population | Expected cases in standard population |
|---|---|---|---|---|---|
| I | di | yi | 105 (di /yi) | wi | di wi/yi |
| Incidence = All new cases in 2005 - 2009/total population (2005-2009). *Scandinavian (“European”) standard is used. | |||||
| 0 - 4 | 0 | 37,610 | 0.00 | 8000 | 0.00 |
| 5 - 9 | 0 | 43,094 | 0.00 | 7000 | 0.00 |
| 10 - 14 | 0 | 49,357 | 0.00 | 7000 | 0.00 |
| 15 - 19 | 0 | 47,870 | 0.00 | 7000 | 0.00 |
| 20 - 24 | 4 | 39,504 | 10.126 | 7000 | 0.71 |
| 25 - 29 | 5 | 35,090 | 14.249 | 7000 | 1.14 |
| 30 - 34 | 7 | 44,878 | 15.598 | 7000 | 0.99 |
| 35 - 39 | 11 | 52,644 | 20.895 | 7000 | 1.46 |
| 40 - 44 | 10 | 53,373 | 18.736 | 7000 | 1.31 |
| 45 - 49 | 4 | 49,851 | 8.024 | 7000 | 0.56 |
| 50 - 54 | 8 | 49,390 | 16.198 | 7000 | 1.13 |
| 55 - 59 | 0 | 50,324 | 0.00 | 6000 | 0.00 |
| 60 - 64 | 0 | 40,691 | 0.00 | 5000 | 0.00 |
| 65 - 69 | 0 | 36,419 | 0.00 | 4000 | 0.00 |
| 70 - 74 | 0 | 29,011 | 0.00 | 3000 | 0.00 |
| 75 - 79 | 0 | 20,835 | 0.00 | 2000 | 0.00 |
| 80 - 84 | 0 | 13,040 | 0.00 | 1000 | 0.00 |
| 85+ | 0 | 7,416 | 0.00 | 1000 | 0.00 |
| Total | 49 | 700,397 | 6.99 | 100 000 | 7.3 |
| Tumor type | Stage | Number = 49 | Percentage |
|---|---|---|---|
| Seminoma | I | 16 | 59% |
| Seminoma | II | 11 | 40.74% |
| Non seminoma | I | 5 | 71.42% |
| Non seminoma | II | 2 | 28.58% |
| Mixed tumor | I | 9 | 60% |
| Mixed tumor | II | 5 | 33.34% |
| Mixed tumor | IV | 1 | 6.76% |