World Journal of Oncology, ISSN 1920-4531 print, 1920-454X online, Open Access
Article copyright, the authors; Journal compilation copyright, World J Oncol and Elmer Press Inc
Journal website http://www.wjon.org

Original Article

Volume 2, Number 1, February 2011, pages 1-9


Radiosensitivity and Capacity to Recover from Radiation-Induced Damage in Pimonidazole-Unlabeled Intratumor Quiescent Cells Depend on p53 Status

Figures

Figure 1.
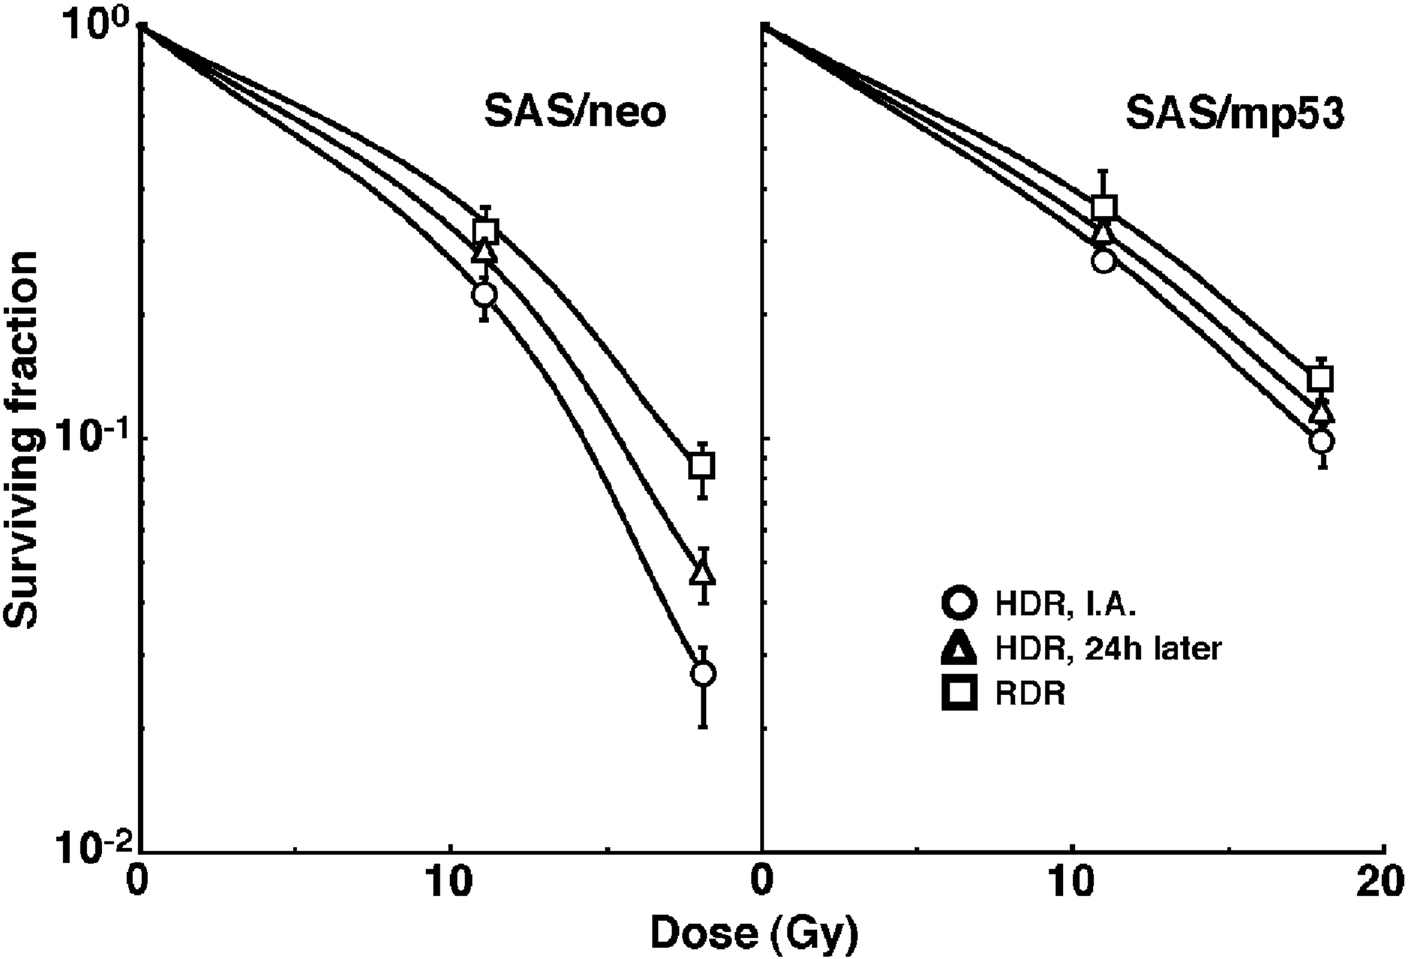
Figure 1. Cell survival curves for the whole tumor cell fraction in the total tumor cell population of SAS/neo (left panel) and SAS/mp53 (right panel) tumors as a function of radiation dose. Circles, triangles and squares represent the surviving fractions immediately after (I.A.), at 24 h after (24h later) high dose-rate (HDR), and reduced dose-rate (RDR) γ-ray irradiation, respectively. Bars represent standard errors.
Figure 2.
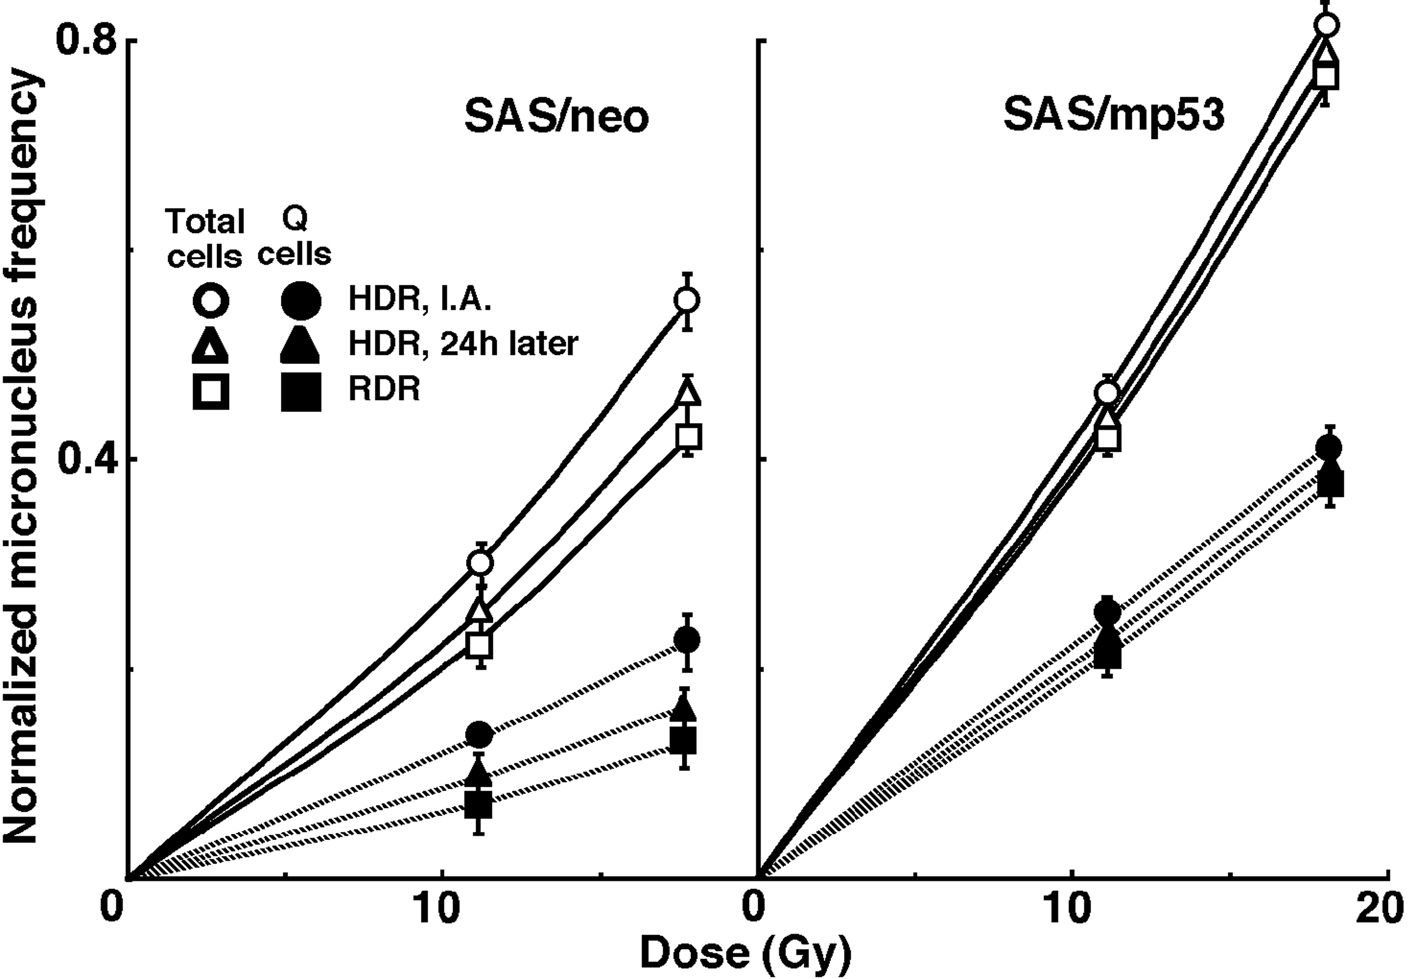
Figure 2. Dose response curves of the normalized micronucleus frequency for the whole tumor cell fraction in the total and quiescent (Q) tumor cell populations of SAS/neo (left panel) and SAS/mp53 (right panel) tumors as a function of radiation dose. Open and solid symbols represent the normalized micronucleus frequencies for total and quiescent tumor cell populations, respectively. Circles, triangles and squares represent the normalized micronucleus frequency immediately after (I.A.), at 24 h after (24h later) high dose-rate (HDR), and reduced dose-rate (RDR) γ-ray irradiation, respectively. Bars represent standard errors.
Figure 3.
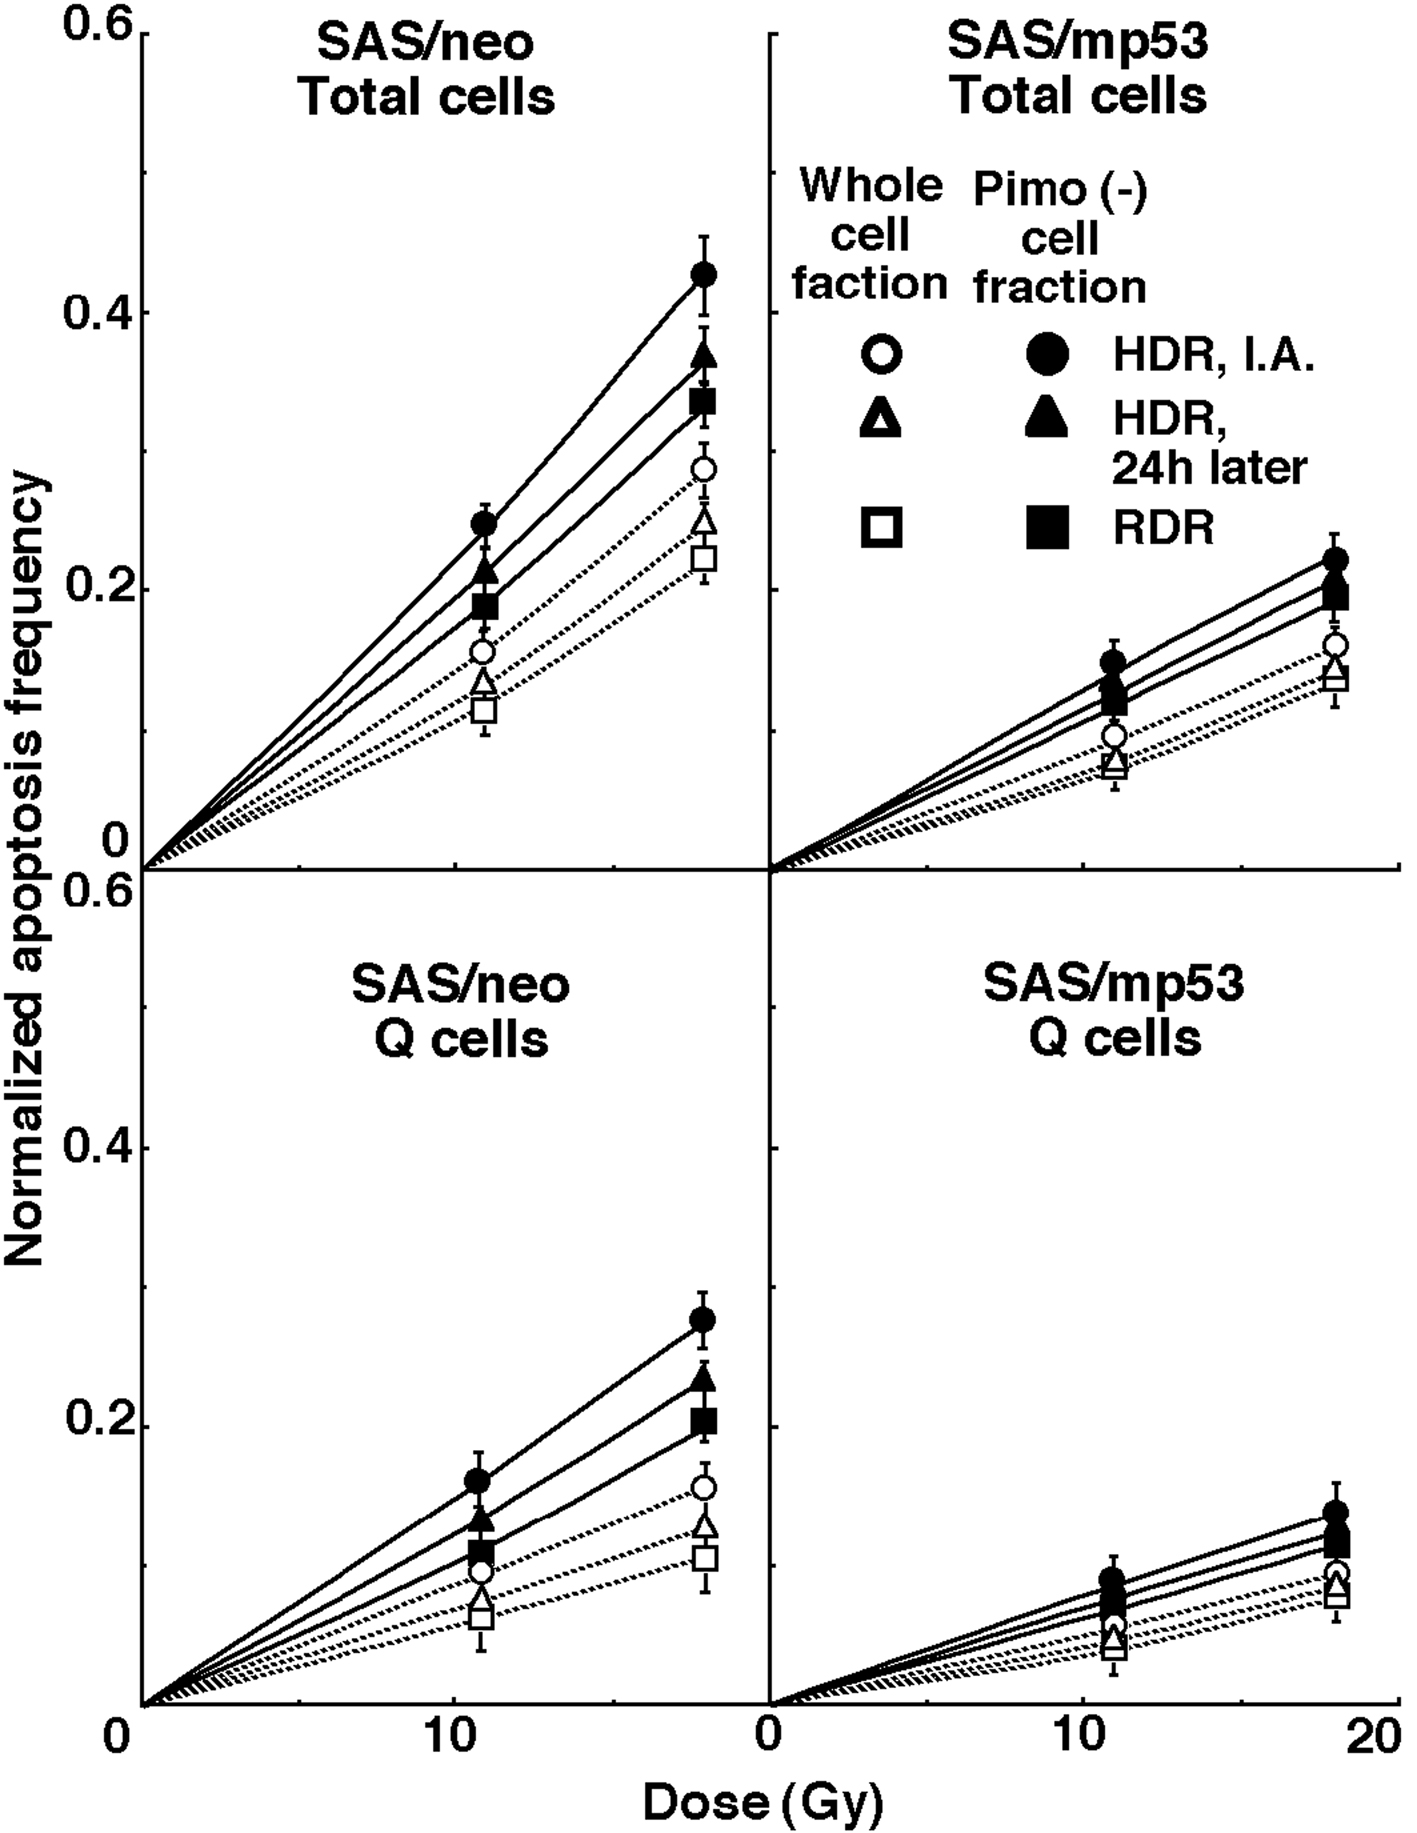
Figure 3. Dose response curves for the normalized apoptosis frequency of the total and quiescent (Q) tumor cell populations of SAS/neo (left panel) and SAS/mp53 (right panel) tumors as a function of radiation dose are shown in the upper and lower panels, respectively. Open and solid symbols represent the normalized apoptosis frequencies for the whole tumor cell fraction and the cell fraction not labeled with pimonidazole (Pimo (-)) in both the total and Q tumor cell populations, respectively. Circles, triangles and squares represent the normalized apoptosis frequency immediately after (I.A.), at 24 h after (24h later) high dose-rate (HDR), and reduced dose-rate (RDR) γ-ray irradiation, respectively. Bars represent standard errors.

Tables

Table 1. Plating Efficiency and Micronucleus Frequency at 0 Gy
 
Total tumor cellsQuiescent cells
a): Mean ± standard error (n = 9)
SAS/neo
Plating efficiency (%)45.5 ± 8.9a)
Micronucleus frequency0.038 ± 0.0060.056 ± 0.007
Apoptosis frequency0.083 ± 0.0080.106 ± 0.015
Especially in pimonidazole unlabeled cell fraction0.045 ± 0.0050.058 ± 0.008
SAS/mp53
Plating efficiency (%)23.5 ± 4.1
Micronucleus frequency0.072 ± 0.0080.111 ± 0.010
Apoptosis frequency0.021 ± 0.0030.033 ± 0.004
Especially in pimonidazole unlabeled cell fraction0.011 ± 0.0010.019 ± 0.003


Table 2. Dose-Modifying Factors for the Pimonidazole-Unlabeled Cell Fraction Compared with the All Cell Fraction in the Total or Quiescent Cell Populationa)
 
High dose-rate Immediately afterHigh dose-rate 24 hours afterReduced dose-rate
a): The ratio of the dose of radiation necessary to obtain the normalized apoptosis frequency of 0.05 in a whole cell fraction to that needed to obtain the frequency in the pimonidazole unlabeled cell fraction.
b): Mean ± standard error (n = 9)
SAS/neo
Total cell population1.45 ± 0.15b)1.45 ± 0.151.45 ± 0.15
Quiescent cell population1.6 ± 0.21.55 ± 0.151.55 ± 0.15
SAS/mp53
Total cell population1.5 ± 0.151.5 ± 0.151.5 ± 0.15
Quiescent cell population1.8 ± 0.251.75 ± 0.21.7 ± 0.2


Table 3. Dose-Modifying Factors due to a Delayed Assay or Reduced Irradiation Dose-Ratea)
 
High dose-rate 24 hours afterReduced dose-rate
a): The ratio of the dose of radiation necessary to obtain each end-point with a delayed assay or reduced dose-rate irradiation to that needed to obtain each end-point with an assay immediately after high dose-rate irradiation.
b): Mean ± standard error (n = 9)
SAS/neo
Surviving fraction = 0.2
  Total cells1.1 ± 0.05b)1.2 ± 0.1
Normalized micronucleus frequency = 0.1
  Total cells1.15 ± 0.051.25 ± 0.1
  Quiescent cells1.3 ± 0.11.6 ± 0.2
Normalized apoptosis frequency = 0.05
  Total cells1.15 ± 0.051.25 ± 0.1
    Especially in pimonidazole unlabeled cell fraction1.15 ± 0.051.3 ± 0.1
  Quiescent cells1.2 ± 0.11.4 ± 0.15
    Especially in pimonidazole unlabeled cell fraction1.35 ± 0.151.6 ± 0.2
SAS/mp53
Surviving fraction = 0.2
  Total cells1.05 ± 0.051.1 ± 0.05
Normalized micronucleus frequency = 0.1
  Total cells1.05 ± 0.051.1 ± 0.05
  Quiescent cells1.1 ± 0.051.15 ± 0.05
Normalized apoptosis frequency = 0.05>
  Total cells1.1 ± 0.051.15 ± 0.05
    Especially in pimonidazole unlabeled cell fraction1.15 ± 0.051.2 ± 0.1
  Quiescent cells1.15 ± 0.051.2 ± 0.1
    Especially in pimonidazole unlabeled cell fraction1.25 ± 0.11.3 ± 0.1


Table 4. Dose-Modifying Factors for Quiescent Cell Population Relative to Total Tumor Cell Populationa)
 
High dose-rate Immediately afterHigh dose-rate 24 hours afterReduced dose-rate
a): The ratio of the dose of radiation necessary to obtain each end-point in the quiescent cell population to that needed to obtain each end-point in the total tumor cell population.
b): Mean ± standard error (n = 9)
SAS/neo
Normalized micronucleus frequency = 0.12.0 ± 0.2b)2.35 ± 0.22.65 ± 0.25
Normalized apoptosis frequency = 0.051.7 ± 0.151.75 ± 0.21.85 ± 0.2
  Especially in pimonidazole unlabeled cell fraction1.55 ± 0.11.6 ± 0.151.65 ± 0.15
SAS/mp53
Normalized micronucleus frequency = 0.11.8 ± 0.21.8 ± 0.21.85 ± 0.2
Normalized apoptosis frequency = 0.051.65 ± 0.151.7 ± 0.151.75 ± 0.2
  Especially in pimonidazole unlabeled cell fraction1.5 ± 0.11.55 ± 0.11.6 ± 0.15