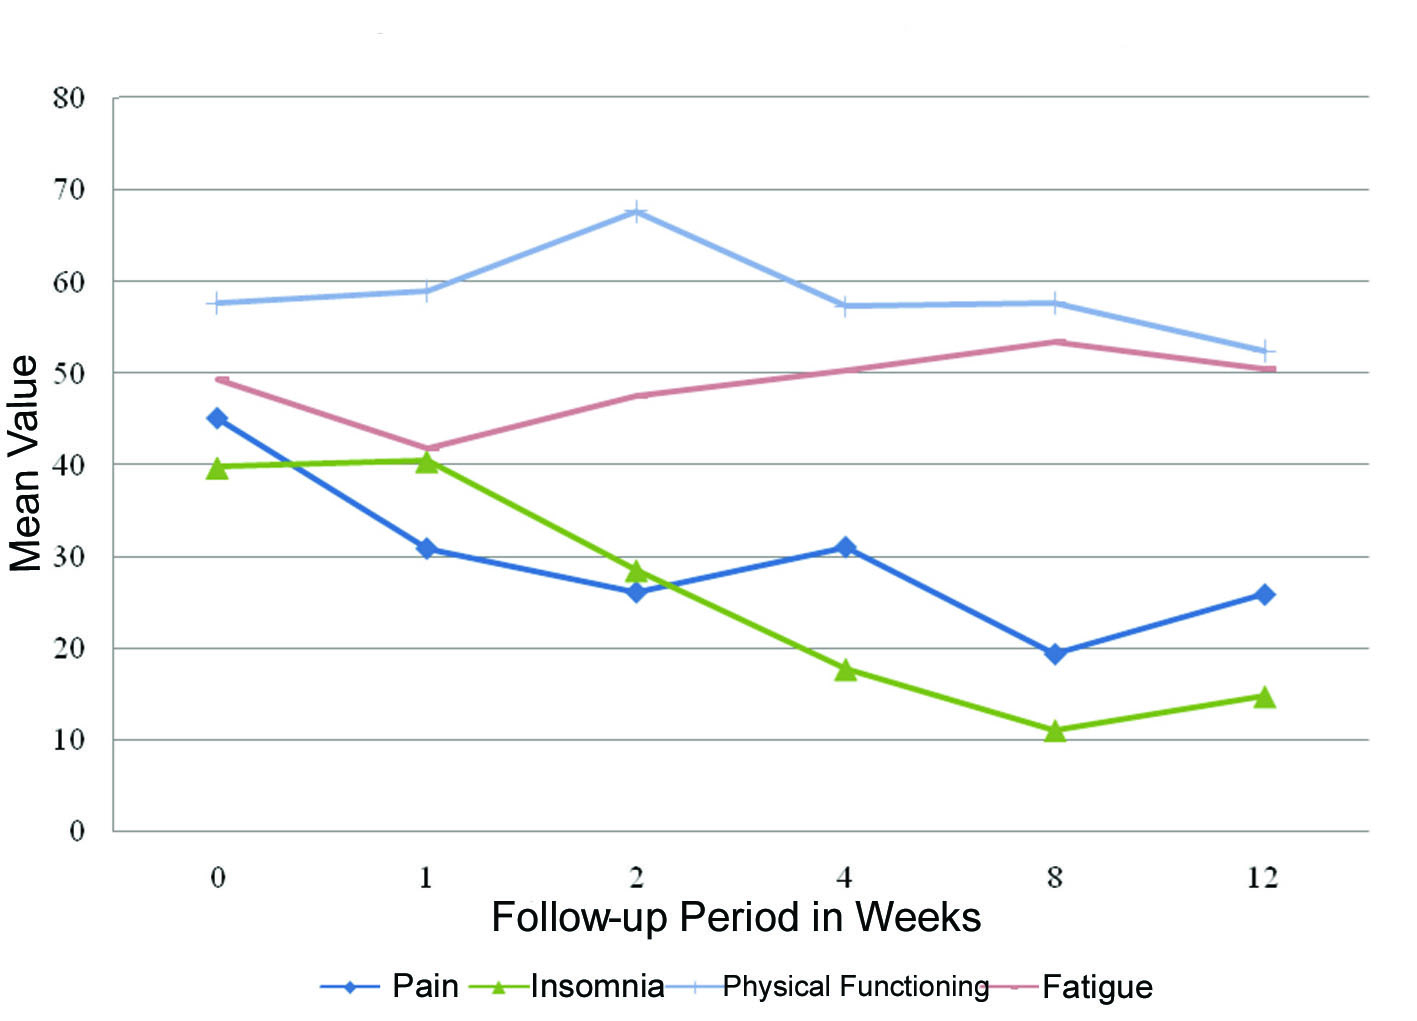
Figure 1. QLQ-C15-PAL scores with significant differences between follow-up and baseline.
| World Journal of Oncology, ISSN 1920-4531 print, 1920-454X online, Open Access |
| Article copyright, the authors; Journal compilation copyright, World J Oncol and Elmer Press Inc |
| Journal website http://www.wjon.org |
Original Article
Volume 2, Number 2, April 2011, pages 70-75
Quality of Life in Patients Treated with Palliative Radiotherapy for Advanced Lung Cancer and Lung Metastases
Figure
Tables
| Age (years) | ||
| n | 31 | |
| Mean ± SD | 68 ± 11 | |
| Inter-quartiles | 58 - 77 | |
| Median (range) | 69 (38 - 85) | |
| Karnofsky Performance Scale | ||
| n | 31 | |
| Mean ± SD | 67 ± 16 | |
| Inter-quartiles | 60 - 80 | |
| Median (range) | 70 (30 - 90) | |
| Palliative Performance Scale | ||
| n | 30 | |
| Mean ± SD | 65 ± 17 | |
| Inter-quartiles | 60 - 80 | |
| Median (range) | 70 (30 - 90) | |
| Gender | ||
| Male | 19 | (61%) |
| Female | 12 | (39%) |
| Primary Cancer Site | ||
| Lung | 25 | (80%) |
| GI-Colon | 2 | (6%) |
| GI-Rectum | 1 | (3%) |
| Breast | 1 | (3%) |
| Prostate | 1 | (3.23%) |
| Renal Cell | 1 | (3%) |
| Symptom Scales/Items | Data Collection Period in Weeks | |||||
|---|---|---|---|---|---|---|
| 0 | 1 | 2 | 4 | 8 | 12 | |
| QLQ-C15-PAL scores were compared between baseline and at each follow-up visit. Scores that show significant differences at the indicated follow-up period are bolded. Significant differences were calculated using Wilcoxon Signed Rank. | ||||||
| Pain | 45.16 | 30.95 | 26.19 | 31.11 | 19.44 | 25.93 |
| Dyspnea | 45.56 | 42.86 | 30.95 | 48.89 | 33.33 | 40.74 |
| Insomnia | 39.78 | 40.48 | 28.57 | 17.78 | 11.11 | 14.81 |
| Appetite Loss | 41.11 | 38.1 | 23.81 | 31.11 | 33.33 | 59.26 |
| Constipation | 30 | 28.57 | 21.43 | 24.44 | 16.67 | 40.74 |
| Overall Quality of Life | 51.67 | 54.76 | 50 | 56.67 | 52.78 | 55.56 |
| Physical Functioning | 57.7 | 59.05 | 67.69 | 57.33 | 57.78 | 52.5 |
| Fatigue | 49.46 | 41.88 | 47.62 | 50.37 | 53.54 | 50.62 |
| Nausea/Vomiting | 12.9 | 15.48 | 11.9 | 8.89 | 15.28 | 12.96 |
| Emotional Functioning | 74.14 | 75.6 | 85.12 | 82.22 | 75 | 64.81 |
| Symptom Scales/Items | Data Collection Period in Weeks | |||||
|---|---|---|---|---|---|---|
| 0 | 1 | 2 | 4 | 8 | 12 | |
| QLQ-LC13 scores were compared between baseline and at each follow-up visit. Scores with a significant difference at the indicated follow-up period are bolded. Significant differences were calculated using Wilcoxon Signed Rank. | ||||||
| Coughing | 49.46 | 42.86 | 45.24 | 42.22 | 36.11 | 25.93 |
| Hemoptysis | 16.13 | 16.67 | 5.13 | 4.44 | 8.33 | 11.11 |
| Sore Mouth | 6.45 | 7.69 | 4.76 | 6.67 | 8.33 | 7.41 |
| Dysphagia | 16.13 | 19.05 | 9.52 | 15.56 | 5.56 | 3.7 |
| Peripheral Neuropathy | 18.89 | 26.19 | 0 | 17.78 | 5.56 | 11.11 |
| Alopecia | 8.89 | 0 | 7.69 | 28.89 | 30.3 | 37.5 |
| Pain in Chest | 27.96 | 30.95 | 26.19 | 15.56 | 19.44 | 22.22 |
| Pain in Arm | 22.58 | 16.67 | 9.52 | 24.44 | 5.56 | 18.52 |
| Pain Other | 39.78 | 25.64 | 12.82 | 26.67 | 30.56 | 44.44 |
| Dyspnea | 30.95 | 33.33 | 16.67 | 30.56 | 26.39 | 36.51 |
| Dsypnea When Rested | 2.33 | 1.5 | 2.25 | 2 | 1.33 | 2.5 |
| Dyspnea When Walked | 2.33 | 2 | 2.75 | 2 | 1.67 | 3 |