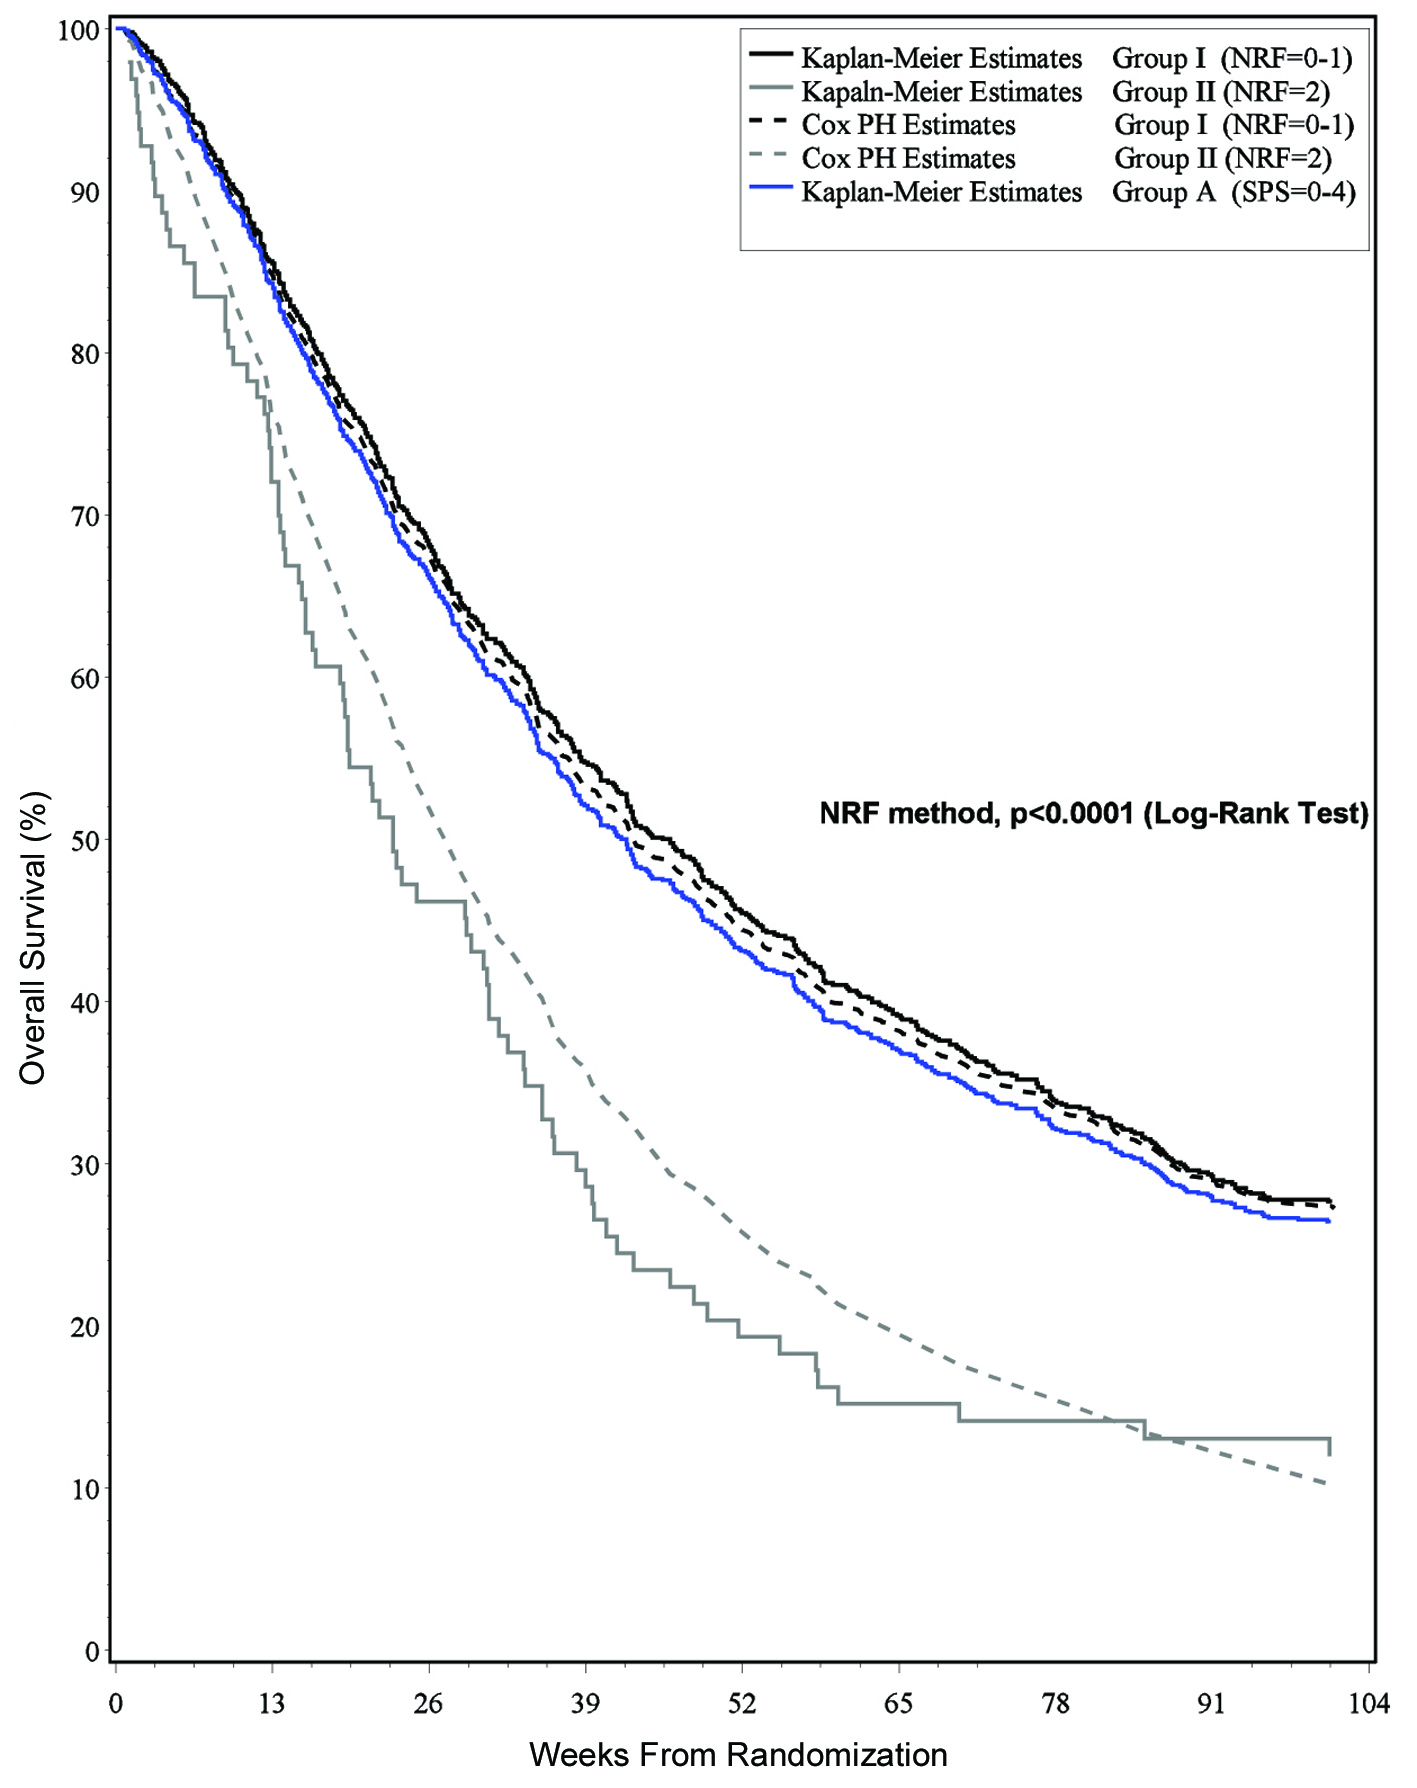
Figure 1. Survival estimates and risk classification group.
| World Journal of Oncology, ISSN 1920-4531 print, 1920-454X online, Open Access |
| Article copyright, the authors; Journal compilation copyright, World J Oncol and Elmer Press Inc |
| Journal website http://www.wjon.org |
Original Article
Volume 2, Number 4, August 2011, pages 181-190
Validation of a Predictive Model for Survival in Patients With Advanced Cancer: Secondary Analysis of RTOG 9714
Figure
Tables
| Prognostic Factor | Partial Score Method | Risk Factor Score Method |
|---|---|---|
| Note: Sum of partial scores equal to survival prediction score (range 0 to 8). | ||
| KPS: Karnofsky performance score | ||
| Primary tumor site | ||
| Breast | 0 | 0 |
| Prostate | 2 | 1 |
| Lung | 3 | 1 |
| Others | 3 | 1 |
| Site of metastases | ||
| Bone only | 0 | 0 |
| Other | 2 | 1 |
| KPS | ||
| > 60 | 0 | 0 |
| ≤ 60 | 3 | 1 |
| Survival Prediction Score (SPS) determined by sum of partial scores | Number of Risk Factors Score (NRF) determined by sum of risk factors | |
| Risk Group A [SPS 0 - 4] | Risk Group I [NRF 0 - 1] | |
| Risk Group B [SPS 5] | Risk Group II [NRF 2] | |
| Risk Group C [SPS 6 - 8] | Risk Group III [NRF 3] | |
| Characteristic | n (%) |
|---|---|
| *BPI: Brief Pain Inventory | |
| Gender | |
| Male | 447 (49) |
| Female | 461 (51) |
| Age (years) | |
| Mean ± SD | 65 ± 12 |
| Median (range) | 67 (31 - 92) |
| Country of Residence | |
| Canada | 38 (4%) |
| USA | 870 (96%) |
| Primary cancer site | |
| Breast | 462 (51) |
| Prostate | 446 (49) |
| Karnofsky performance status (KPS) | |
| 40 - 60 | 214 (24) |
| 70 - 100 | 694 (76) |
| Physician predicted survival time (months) | |
| Mean ± SD | 14.5 ± 14 |
| Median (range) | 12 (1 - 99) |
| Painful site(s) | |
| Single | 542 (60) |
| Multiple | 366 (40) |
| Site of radiotherapy | |
| Weight bearing | 506 (56) |
| Non-weight bearing | 402 (44) |
| BPI worst pain score at study entry* | |
| < 5 with ≥ 60 mg/day morphine | 17 (2) |
| 5 - 6 | 254 (28) |
| 7 - 10 | 637 (70) |
| Receiving biphosphanotes at study entry | |
| No | 688 (76) |
| Yes | 220 (24) |
| Radiation treatment assignment | |
| 8 Gy | 460 (49) |
| 30 Gy | 448 (51) |
| Prognostic Factor | Parameter Estimate* | Standard Error | Hazard Ratio [95% CI] | P-value | Partial Score | Risk Factor Score |
|---|---|---|---|---|---|---|
| *Cox Proportional Hazards Regression Model | ||||||
| Primary Cancer Site | ||||||
| Breast | 0.00 | 1.00 | 0 | 0 | ||
| Prostate | 0.42 | 0.07 | 1.52 [1.33, 1.74] | < 0.0001 | 2 | 1 |
| Site of metastases | ||||||
| Bone only | — | — | — | — | 0 | 0 |
| Karnofsky Performance Status | ||||||
| > 60 | 0.00 | 0 | 0 | |||
| ≤ 60 | 0.46 | 0.08 | 1.58 [1.35, 1.85] | < 0.0001 | 2 | 1 |
| Survival Prediction Score (SPS) [sum of partial scores] | Risk Group A [SPS 0 - 4] | |||||
| Number of Risk Factors Score (NRF) [sum of risk factors] | Risk Group I [NRF 0 - 1] | |||||
| Risk Group II [NRF 2] | ||||||
| Predictive Model | Training Set | Temporal Validation Set | External Validation Set [Single Institution] | RTOG External Validation Set [Multiple Institutions] |
|---|---|---|---|---|
| N = 395 | N = 445 | N = 467 | N = 908 | |
| Model Performance | ||||
| Harrel C index | 0.66 | 0.65 | 0.63 | 0.96 |
| Risk Group A | ||||
| [Survival Prediction Score, 0 - 4] | ||||
| n (%) | 108 (27%) | 126 (28%) | 65 (14%) | 908 (100%) |
| Median Survival (weeks) | 60 | 53 | 64 | 42 |
| 95% CI | [41, 70] | [36, 75] | [28, undefined] | [38, 45] |
| Survival Probabilities | ||||
| 3 months | 82% | 86% | 83% | 84% |
| 6 months | 70% | 72% | 64% | 66% |
| 9 months | 52% | 51% | 53% | 43% |
| Predictive Model | Training Set | Temporal Validation Set | External Validation Set [Single Institution] | RTOG External Validation Set [Multiple Institutions] |
|---|---|---|---|---|
| N = 395 | N = 445 | N = 467 | N = 908 | |
| *Risk factors include prostate primary tumor and KPS ≤ 60. | ||||
| Model Performance | ||||
| Harrel C index | 0.65 | 0.66 | 0.63 | 0.94 |
| Royston and Sauerbrei D statistic | 1.09 | 1.08 | 0.84 | 0.82 |
| Risk Group I | ||||
| Number of Risk Factors* ≤ 1 | ||||
| n (%) | 98 (25%) | 116 (26%) | 64 (14%) | 812 (89%) |
| Median Survival (weeks) | 60 | 55 | 64 | 45 |
| 95% CI | [37, 70] | [37, 91] | [28, undefined] | [41, 51] |
| Survival Probabilities | ||||
| 3 months | 80% | 87% | 83% | 85% |
| 6 months | 68% | 73% | 63% | 69% |
| 9 months | 53% | 54% | 53% | 46% |
| Risk Group II | ||||
| Number of Risk Factors = 2 | ||||
| n (%) | 166 (42%) | 193 (43%) | 189 (40%) | 96 (11%) |
| Median Survival (weeks) | 26 | 19 | 28 | 23 |
| 95% CI | [20, 31] | [17, 28] | [22, 34] | [17, 31] |
| Survival Probabilities | ||||
| 3 months | 73% | 68% | 76% | 72% |
| 6 months | 51% | 45% | 52% | 46% |
| 9 months | 26% | 23% | 25% | 19% |
| 1999, RRRP (n = 395) | 2000, RRRP (n = 445) | 2002, PMH (n = 468) | |
|---|---|---|---|
| Gender | N (%) | N (%) | N (%) |
| Male | 198 (50%) | 243 (56%) | 246 (53%) |
| Female | 197 (50%) | 202 (45%) | 222 (47%) |
| Age (years) | |||
| Median | 68 | 69 | 66 |
| Range | 31 - 93 | 24 - 93 | 24 - 91 |
| Primary cancer site | |||
| Lung | 143 (36%) | 132 (30%) | 266 (55%) |
| Breast | 80 (20%) | 99 (22%) | 62 (13%) |
| Prostate | 56 (14%) | 70 (16%) | 24 (5%) |
| Others | 116 (30%) | 144 (32%) | 126 (27%) |
| Weight loss | |||
| ≥ 10% over the last 6 months | 132 (33%) | 141 (32%) | 108 (23%) |
| Site of metastases | |||
| Bone only | 113 (29%) | 164 (37%) | 80 (17%) |
| Others | 282 (71%) | 281 (63%) | 388 (83%) |
| Karnofsky performance score | |||
| 10 - 20, ECOG 4 | 2 (0.5%) | 2 (0.4%) | 32 (7%) |
| 30 - 40, ECOG 3 | 44 (11%) | 56 (13%) | 112 (24%) |
| 50 - 60, ECOG 2 | 163 (41%) | 208 (47%) | 140 (30%) |
| 70 - 80, ECOG 1 | 167 (42%) | 152 (34%) | 160 (34%) |
| 90 - 100, ECOG 0 | 19 (5%) | 27 (6%) | 23 (5%) |
| Median | 60 | 60 | 2 |
| Range | 10 - 100 | 10 - 100 | 0 - 4 |