World Journal of Oncology, ISSN 1920-4531 print, 1920-454X online, Open Access
Article copyright, the authors; Journal compilation copyright, World J Oncol and Elmer Press Inc
Journal website http://www.wjon.org

Original Article

Volume 2, Number 6, December 2011, pages 281-288


Symptom Clusters in Cancer Patients With Bone Metastases: Subanalysis of Patients Reporting Exclusively Non-zero ESAS Scores

Figures

Figure 1.
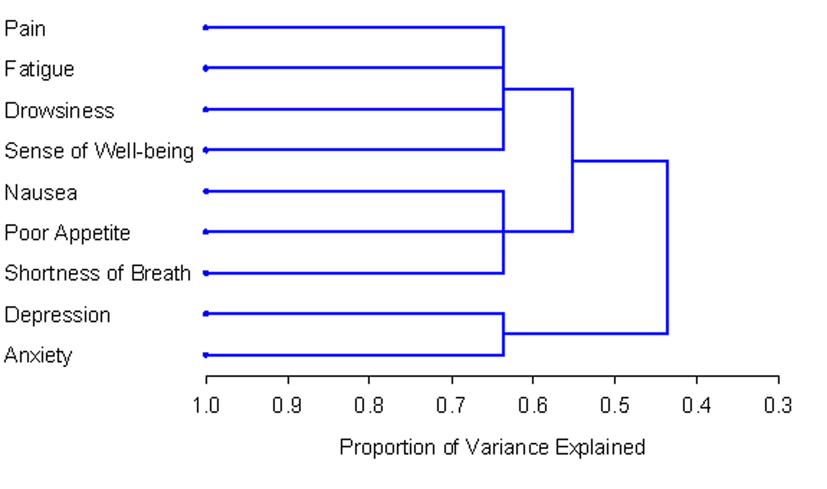
Figure 1. PROC TREE procedure generated dendrogram displaying three cluster solution and cluster hierarchy in 518 patients. Possible one cluster, two cluster and three cluster solutions explained 43.6%, 55.2% and 63.7% of the total variation, respectively.
Figure 2.
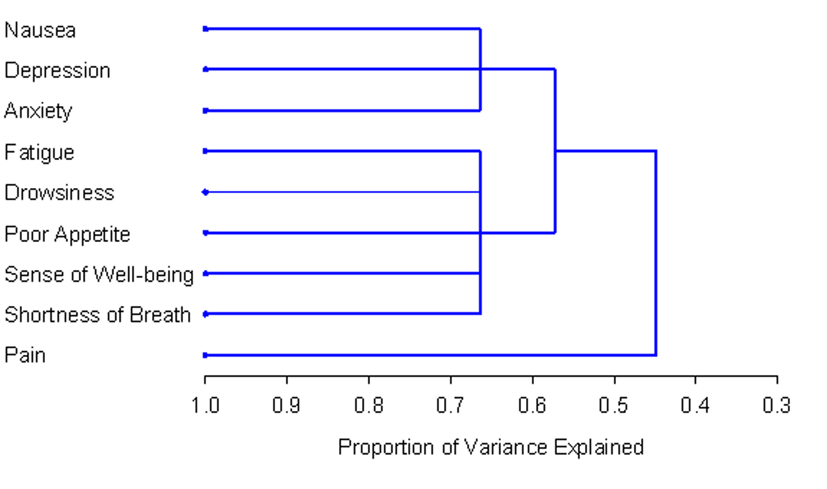
Figure 2. PROC TREE procedure generated dendrogram displaying two cluster solution and cluster hierarchy in 129 patients with non-zero record at baseline. Possible one and two cluster solutions explained 44.8% and 57.3% of the total variation, respectively.

Tables

Table 1. Baseline Symptom Clusters in the Total Patient Sample (T) and Non-zero Subgroup (NZ)
 
SymptomPCAEFAHCA
TNZTNZTNZ
PCA: Principal Component Analysis; EFA: Exploratory Factor Analysis; HCA: Hierarchical Cluster Analysis.
Symptoms with corresponding symbols indicate they were in the same cluster.
Dash indicates the symptom was not present in any clusters.
DepressionΔΔΔΔΔΔ
AnxietyΔΔΔΔΔΔ
FatigueΟΟΟOΟΟ
DrowsinessΟΟΟOΟΟ
PainOΟOO
NauseaXΔΟΔXΔ
Poor appetiteXΔΟOXO
DyspneaXΟΟOXΟ
Poor well-beingOOΟOOO


Table 2. Factor Loadings and Final Communality From the Principal Component Analysis of ESAS Symptoms in Non-zero Subgroup at Baseline (n = 129)
 
SymptomComponent 1Component 2Component 3Final communality
Symptoms with bolded factor loadings were in the same cluster.
Depression0.840.210.200.79
Nausea0.750.23-0.120.63
Anxiety0.750.260.310.73
Poor appetite0.540.40-0.210.50
Drowsiness0.120.890.060.80
Fatigue0.320.730.310.72
Shortness of breath0.360.63-0.100.54
Sense of well-being0.500.560.110.58
Pain0.060.070.910.84
% of variance471210
Cronbach’s alpha0.790.80
Eigenvalue4.221.07


Table 3. Factor Loadings and Final Communality Determined Using Exploratory Factor Analysis in Total Patient Sample at Baseline (n = 518)
 
Factor 1Factor 2Final communality
Symptoms with bolded factor loadings were in the same cluster.
Drowsiness0.670.200.49
Fatigue0.660.230.49
Sense of Well-being0.650.360.55
Poor Appetite0.630.200.44
Pain0.510.140.28
Nausea0.490.260.31
Shortness of Breath0.440.130.21
Depression0.290.890.87
Anxiety0.230.690.53
% of variance82.517.5
Cronbach’s alpha0.820.81
Eigenvalue10.732.27


Table 4. Factors (Clusters) Determined Using Exploratory Factor Analysis in Non-zero Subgroup at Baseline (n = 129)
 
Factor 1Factor 2Final communality
Symptoms with bolded factor loadings were in the same cluster.
Drowsiness0.760.180.61
Fatigue0.720.340.64
Sense of Well-being0.540.430.48
Shortness of Breath0.530.300.37
Poor Appetite0.430.310.28
Pain0.160.140.04
Depression0.250.910.89
Anxiety0.360.720.64
Nausea0.370.480.37
% of variance85.814.2
Cronbach’s alpha0.760.80
Eigenvalue13.862.30