World Journal of Oncology, ISSN 1920-4531 print, 1920-454X online, Open Access
Article copyright, the authors; Journal compilation copyright, World J Oncol and Elmer Press Inc
Journal website http://www.wjon.org

Original Article

Volume 3, Number 1, February 2012, pages 8-15


Symptom Clusters in Patients With Bone Metastases: A Sub-Analysis of Patients Reporting Exclusively Non-Zero BPI Scores

Figures

Figure 1.
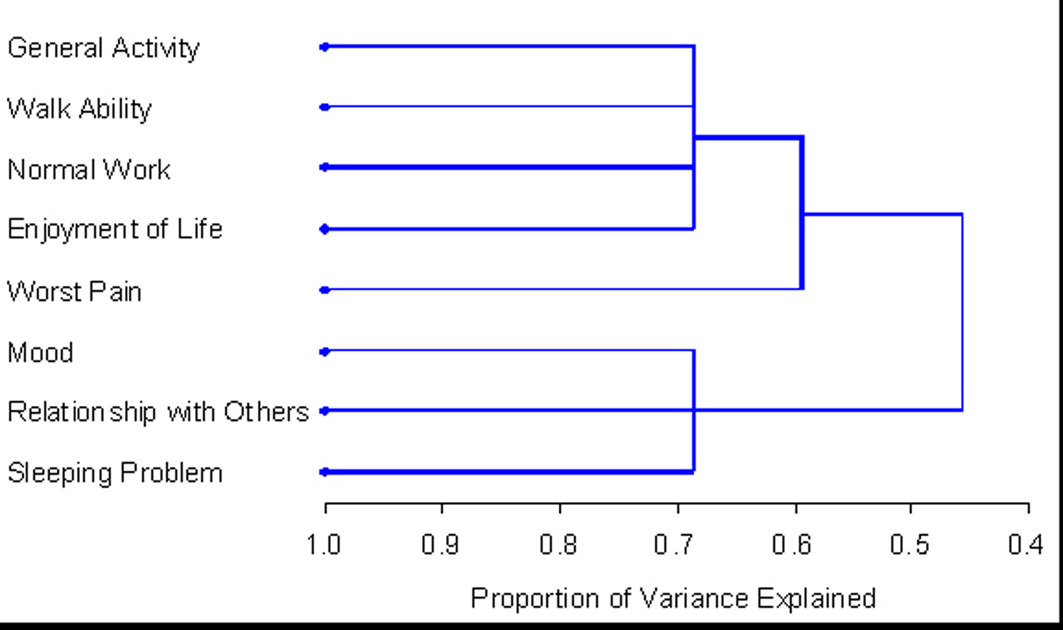
Figure 1. PROC TREE procedure generated dendrogram displaying three cluster solution and cluster hierarchy in 348 patients. One cluster (general activity, walk ability, normal work, and enjoyment) explained 53.9% of total variation; when adding worst pain, it explained up to 65.1% of total variation; when adding additional 3 items, the clusters explained up to 73.5% of total variation.
Figure 2.
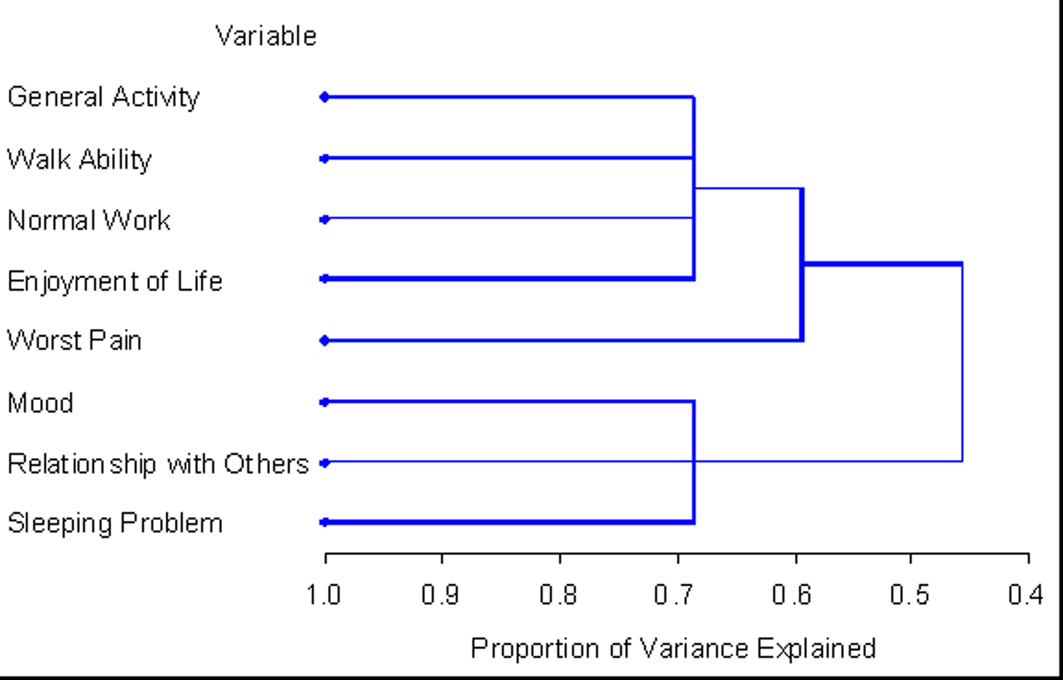
Figure 2. PROC TREE procedure generated dendrogram displaying two cluster solution and cluster hierarchy in 138 patients with non-zero record at baseline. One cluster (general activity, walk ability, normal work, and enjoyment) explained 45.6% of total variation; when adding worst pain, it explained up to 59.3% of total variation; when adding additional 3 items, the clusters explained up to 68.7% of total variation.

Tables

Table 1. Baseline Symptom Clusters in the Total Patient Sample (T) and Non-Zero Subgroup (NZ)
 
SymptomPCAEFAHCA
T (n = 348)NZ (n = 138)T (n = 348)NZ (n = 138)T (n = 348)NZ (n = 138)
aPCA, Principal Component Analysis; EFA, Exploratory Factor Analysis; HCA, Hierarchical Cluster Analysis. bSymptoms with corresponding symbols indicate they were in the same cluster.cDash indicates the symptom was not present in any clusters.
Worst PainΔΔΔΔΔ
General ActivityΔΔΔΔΔΔ
Walking AbilityΔΔΔΔΔΔ
Normal WorkΔΔΔΔΔΔ
Enjoyment of LifeΔΔΔΔΔΔ
MoodΟΟ---ΟΟΟ
Relations with othersΟΟ---ΟΟΟ
SleepΟΟ---Ο---Ο


Table 2. Factor Loadings and Final Communality From the Principal Component Analysis of BPI Symptoms in the Non-Zero Subgroup at Baseline (n = 138)
 
Component 1Component 2Final communality
aBPI, Brief Pain Inventory. bSymptoms with bolded factor loadings were in the same cluster.
General activity0.810.270.72
Normal work0.810.250.72
Walking ability0.720.070.53
Enjoyment of life0.650.270.50
Worst Pain0.570.180.36
Mood0.230.820.72
Relations with others0.300.790.72
Sleep0.130.730.55
% of variance46.3%13.8%
Cronbach’s alpha0.800.74
Eigenvalue3.701.11


Table 3. Factor Loadings and Final Communality Determined Using Exploratory Factor Analysis in Total Patient Sample at Baseline (n = 348)
 
Factor 1Final communality
General activity0.860.73
Normal work0.770.59
Walking ability0.670.45
Enjoyment of life0.840.70
Worst Pain0.640.41
Mood0.650.42
Relations with others0.540.30
Sleep0.540.29
% of variance100%
Cronbach’s alpha0.88
Eigenvalue9.58


Table 4. Factor Loadings and Final Communality Determined Using Exploratory Factor Analysis in Non-Zero Subgroup at Baseline (n = 138)
 
Factor 1Factor 2Final communality
General activity0.800.260.71
Normal work0.790.260.70
Walking ability0.560.180.35
Enjoyment of life0.620.310.37
Worst Pain0.420.230.23
Mood0.250.730.60
Relations with others0.260.790.69
Sleep0.230.460.27
% of variance82.0%17.9%
Cronbach’s alpha0.800.74
Eigenvalue8.491.86