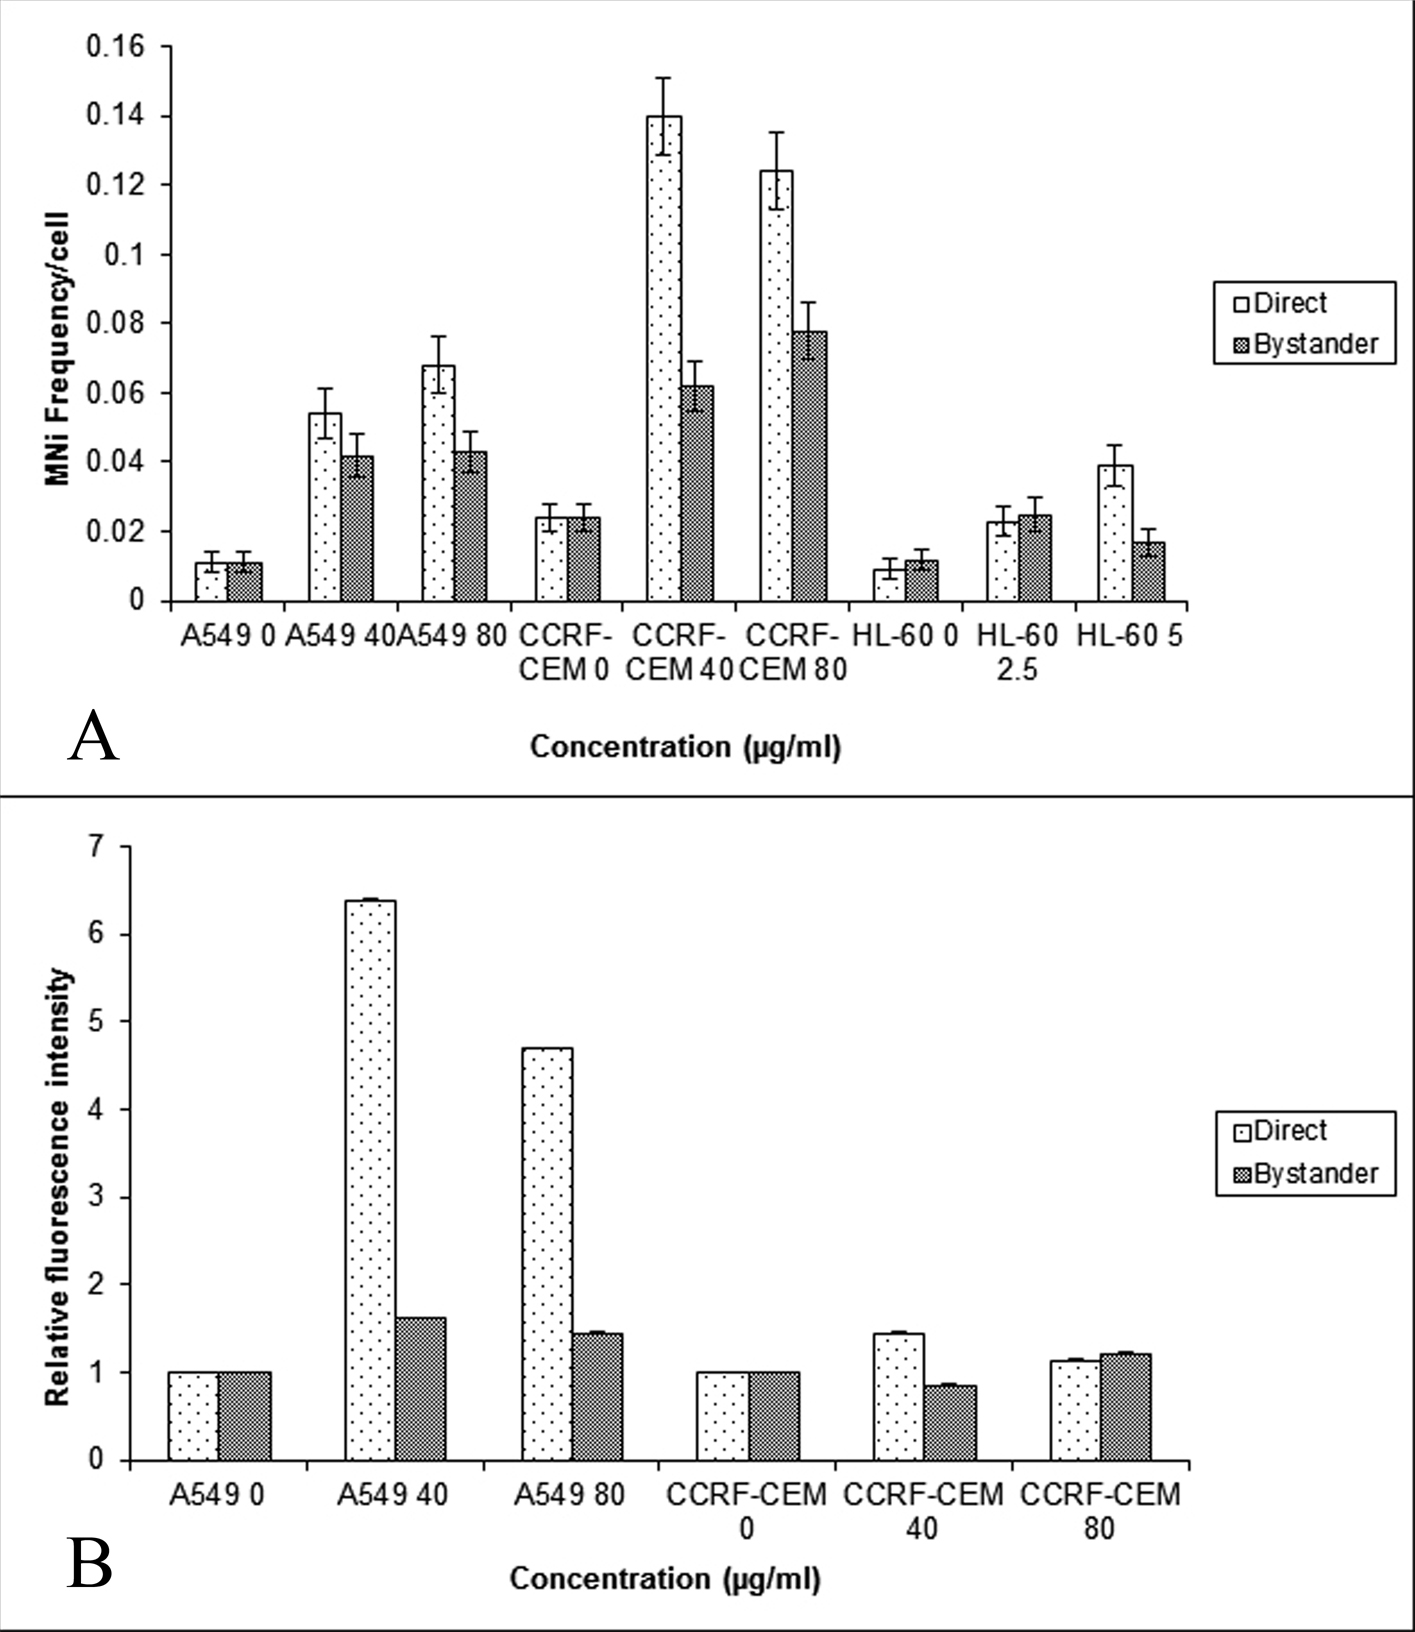
Figure 1. Comparison of the MN frequency in the A549, CCRF-CEM and HL-60 cells (A) and γH2AX relative fluorescent intensity (B) obtained using flow cytometry in the A549 and CCRF-CEM cells that are exposed to BLM and then co-cultured with their respective bystander cells for 24hrs. Each bar represents the mean ± SE of the frequency of micronuclei and relative fluorescence intensity induced for three independent experiments (n = 3).
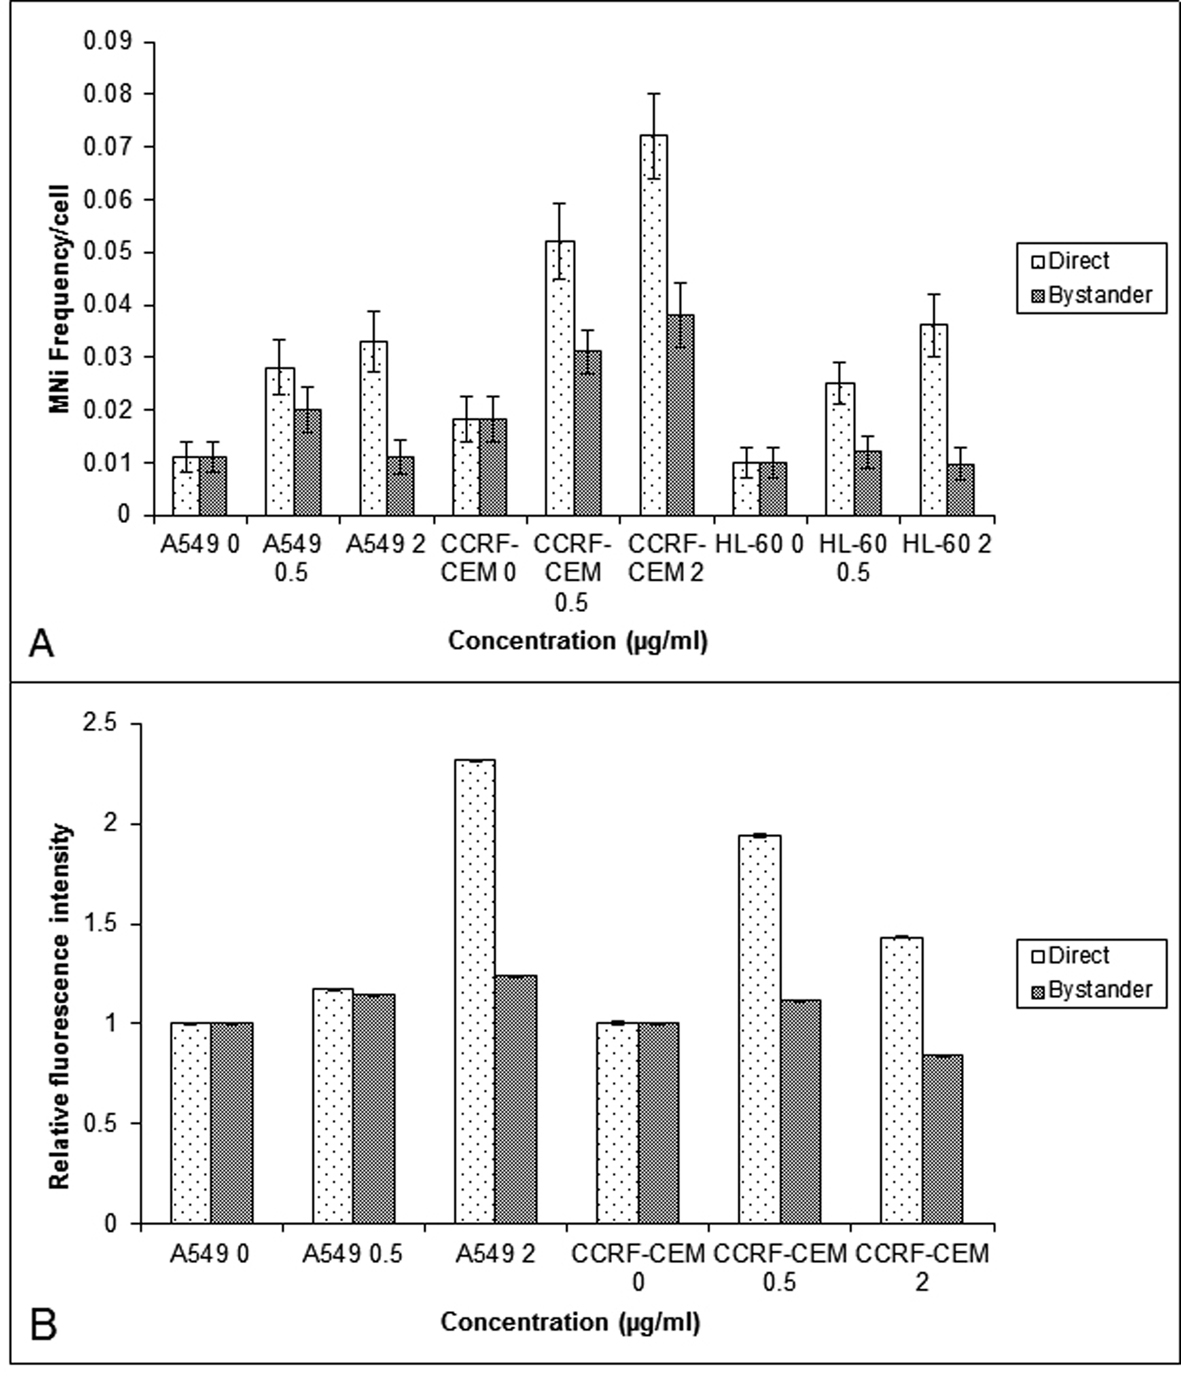
Figure 2. Comparison of the MN frequency in the A549, CCRF-CEM and HL-60 cells (A) and γH2AX relative fluorescent intensity (B) obtained using flow cytometry in the A549 and CCRF-CEM cells that are exposed to NCS and then co-cultured with their respective bystander cells for 24 hrs. Each bar represents the mean ± SE of the frequency of micronuclei and relative fluorescence intensity induced for three independent experiments (n = 3).
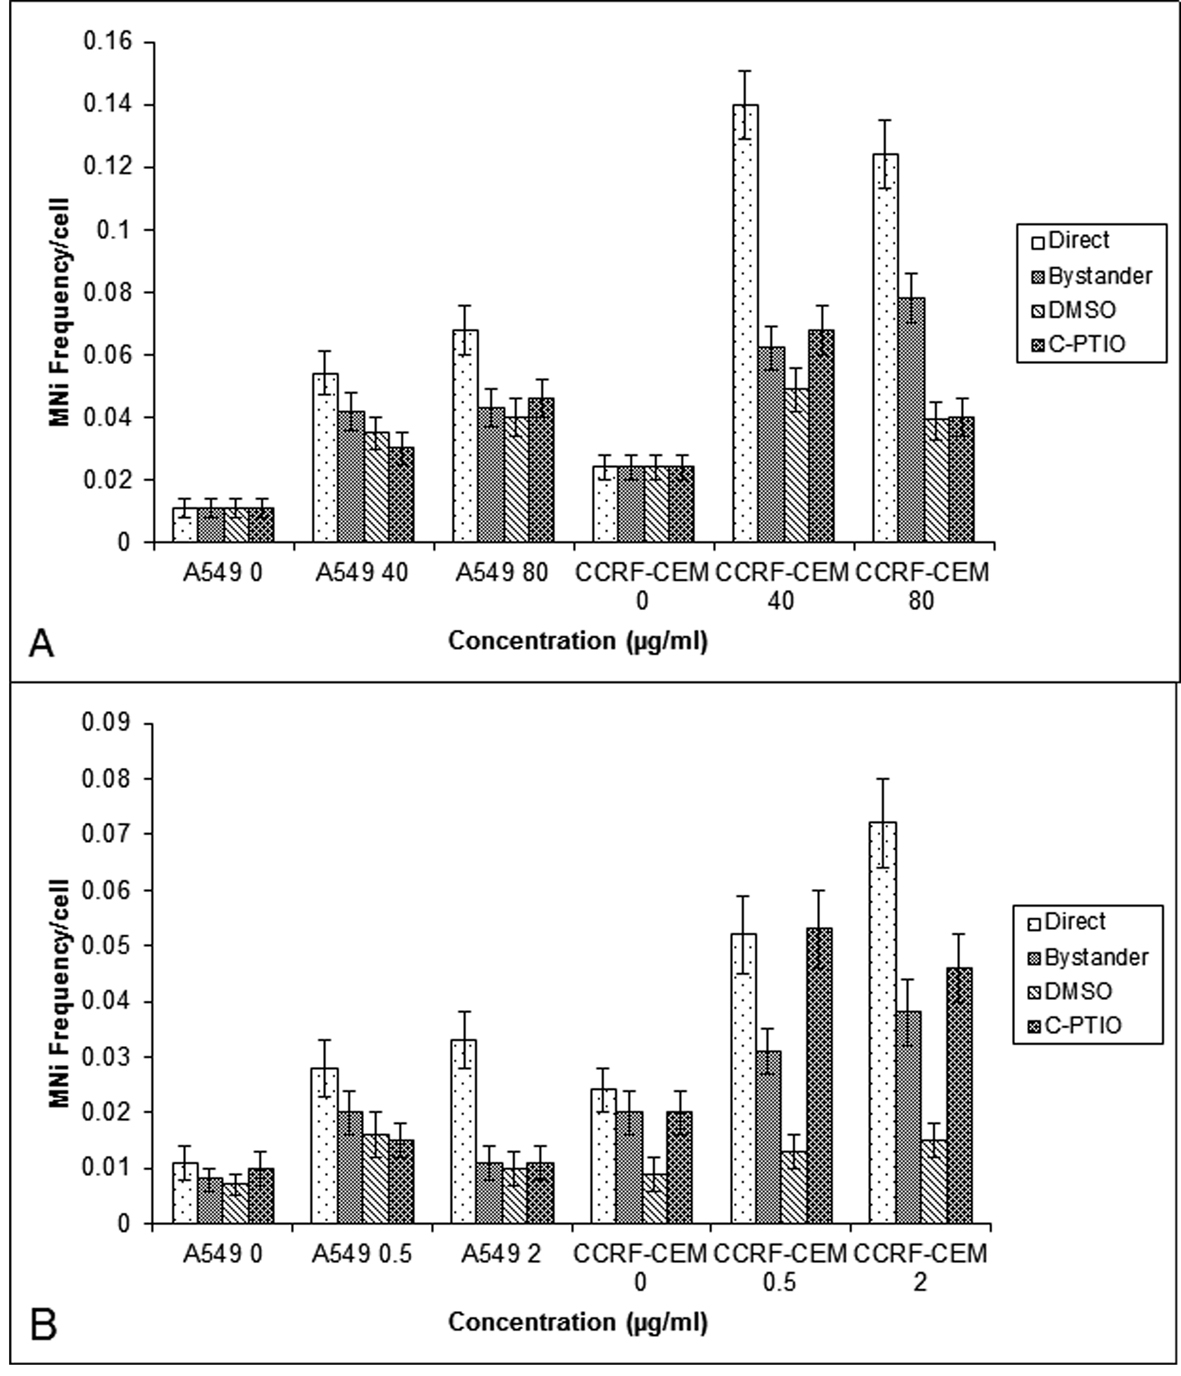
Figure 3. MN frequency obtained in the A549 and CCRF-CEM cells that are exposed to BLM (A) or NCS (B) and then co-cultured with their respective bystander cells for 24 hrs with and without DMSO or C-PTIO. Each bar represents the mean ± SE of the frequency of micronuclei induced for three independent experiments (n = 3).
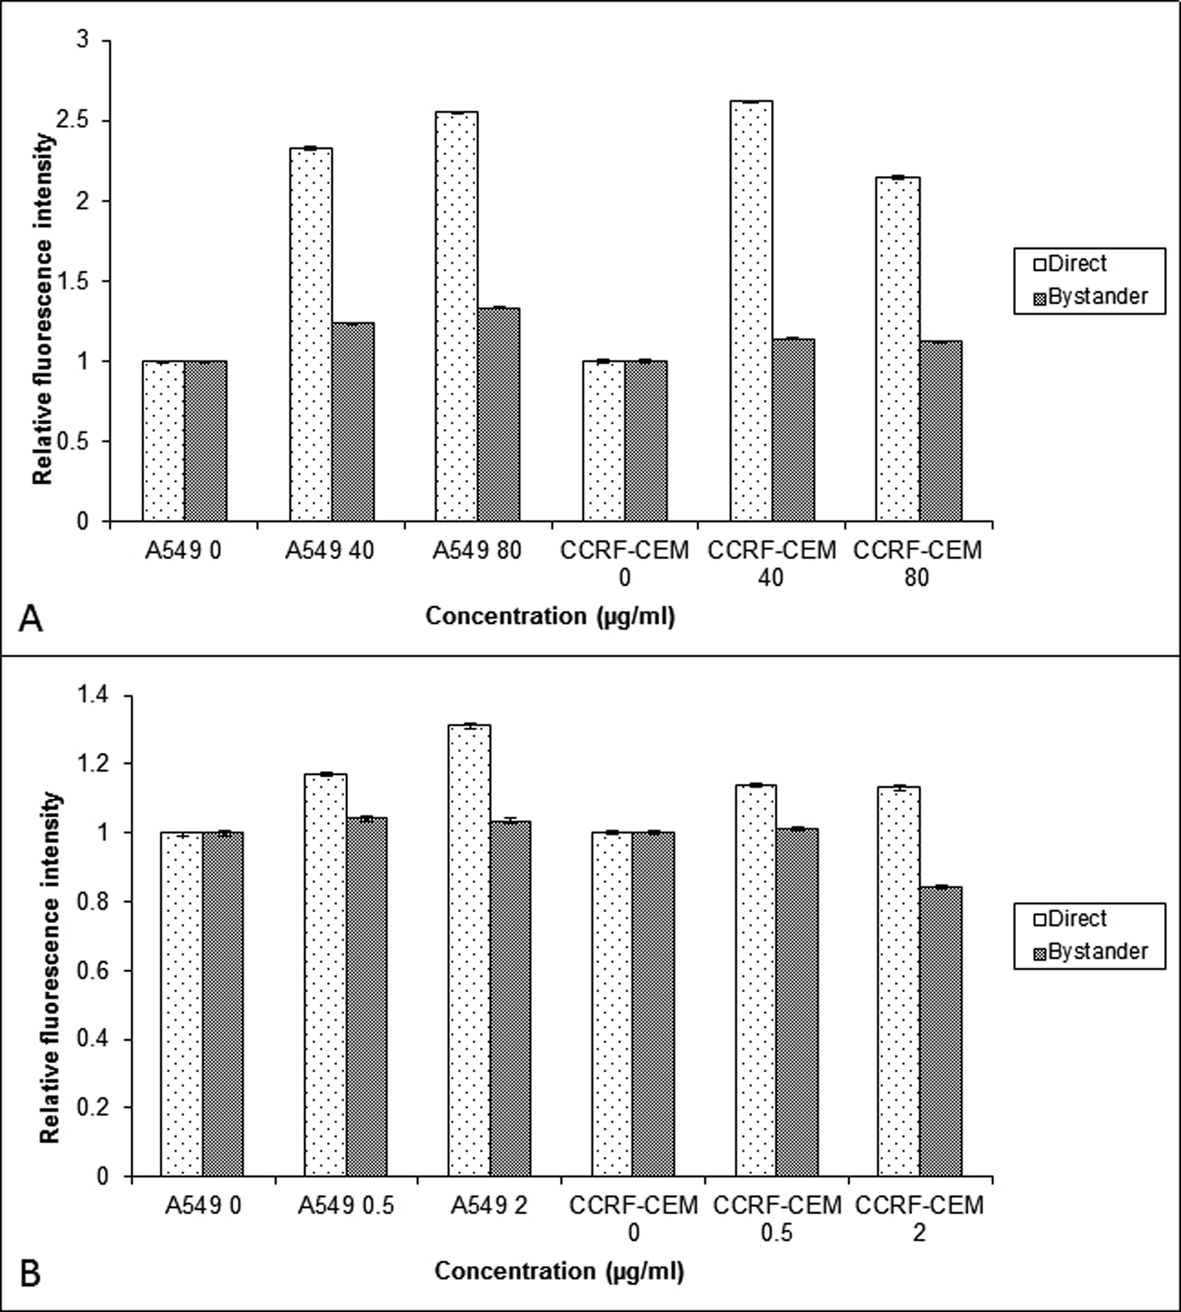
Figure 4. Comparison of the COX-2 relative fluorescent intensity obtained using flow cytometry in the A549 and CCRF-CEM cells that are exposed to BLM (A) and NCS (B) and then co-cultured with their respective bystander cells for 24 hrs. Each bar represents the mean ± SE of the relative fluorescence intensity induced for three independent experiments (n = 3).