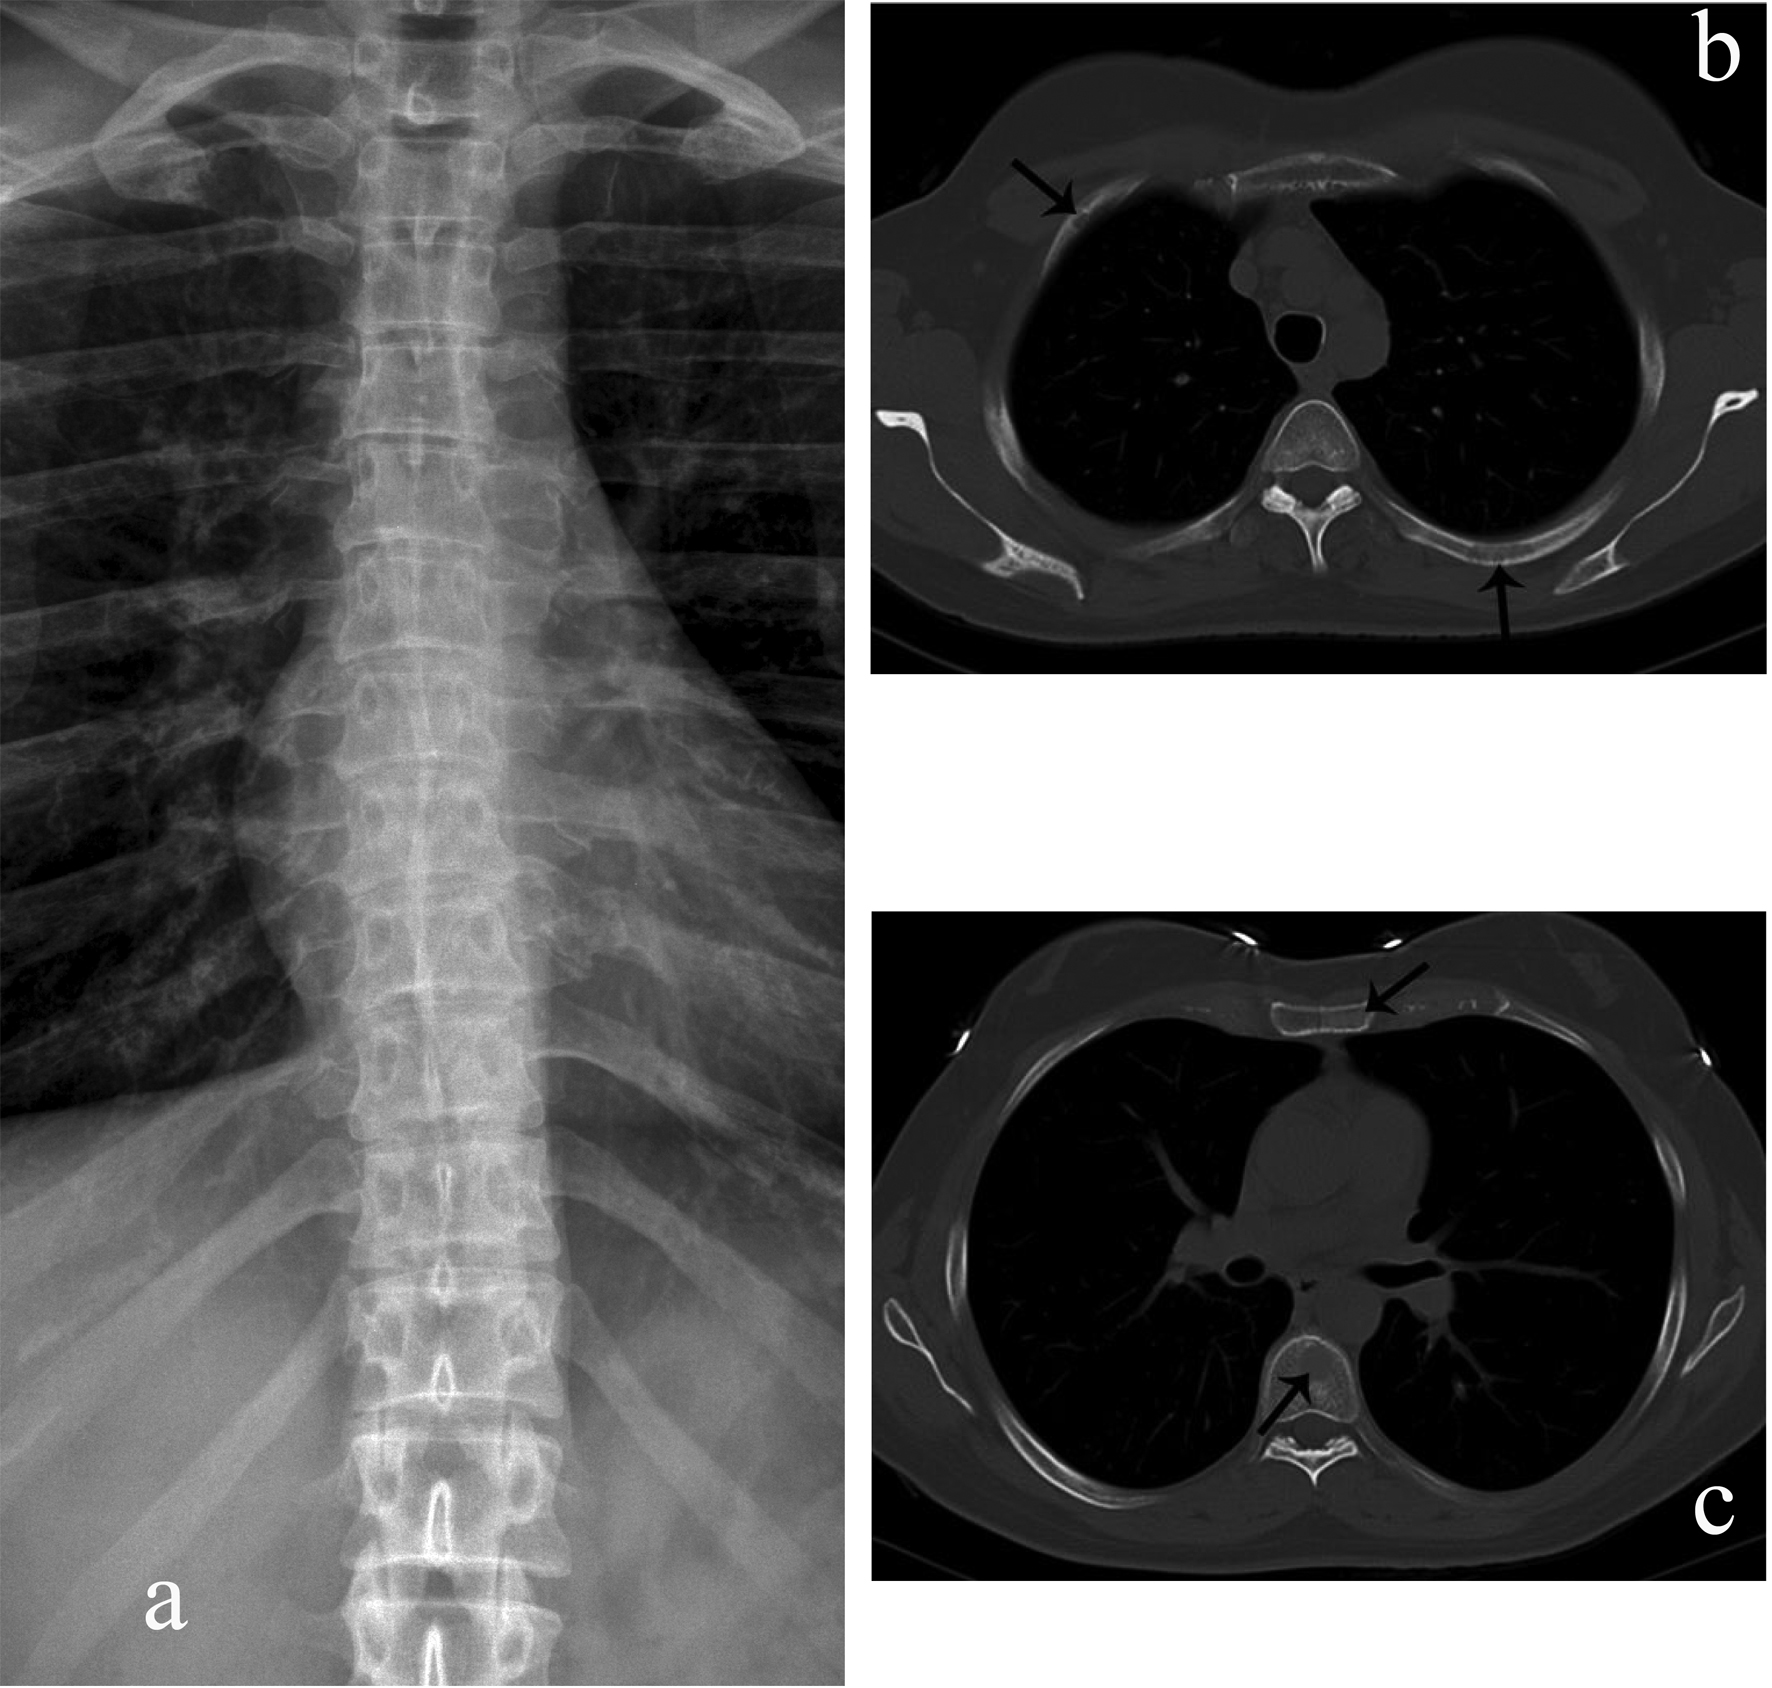
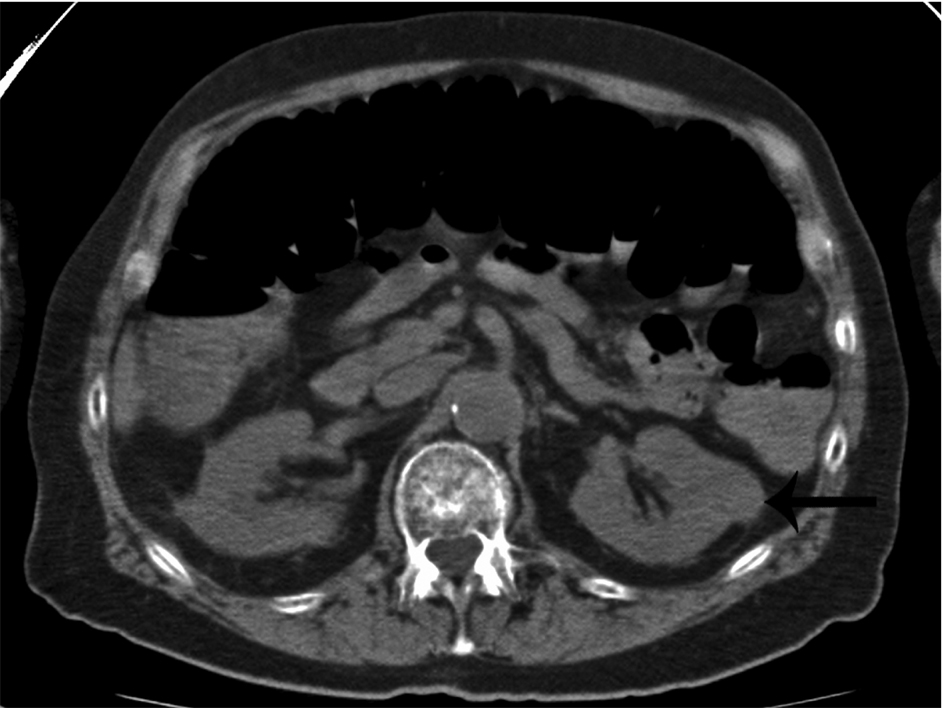
Figure 1. Rib, sternal, and vertebral body myelomatous lesions seen by WBCT (arrows) (b, c) but not conventional skeletal radiography (a).
| World Journal of Oncology, ISSN 1920-4531 print, 1920-454X online, Open Access |
| Article copyright, the authors; Journal compilation copyright, World J Oncol and Elmer Press Inc |
| Journal website http://www.wjon.org |
Original Article
Volume 3, Number 4, August 2012, pages 147-157
Detection of Skeletal Lesions by Whole Body Multidetector Computed Tomography in Multiple Myeloma has no Impact on Long-Term Outcomes Post Autologous Hematopoietic Cell Transplantation
Figures
Tables
| Characteristics | Group 1 (n = 41) | Group 2 (n = 31) |
|---|---|---|
| Abbreviations: HCT: hematopoietic cell transplant; FISH: fluorescence in situ hybridization; ISS: international staging system; B2M: beta 2 microglobulin; WBCT: whole body computerized tomography; CSS: conventional skeletal survey; Group 1: Patients who had more myelomatous bone disease detected on WBCT than CSS; Group 2: Patients without any differences between CSS and WBCT in the detection of myelomatous bone disease. | ||
| Male/female | 22/19 | 17/14 |
| Age, median (range) years | 58 (25 - 75) | 59 (43 - 75) |
| Durie-Salmon/ ISS | ||
| I A/I | 2/19 | 3/11 |
| II A/I | 12/11 | 9/11 |
| III A/IIIB/III | 23/4/5 | 13/6/5 |
| B2M, mg/L, median (range) | 2.27 (0.84 - 14.1) | 2.6 (1.45 - 69.6) |
| Median follow-up (range), months | 36 (6 - 84) | 31 (11 - 73) |
| Lines of therapy before HCT | ||
| 1 | 28 | 20 |
| 2 | 9 | 7 |
| 3 | 4 | 4 |
| Conditioning for first autologous HCT | ||
| Melphalan | 32 | 18 |
| Busulfan/cyclophosphamide +/- etoposide | 9 | 13 |
| Cytogenetics/FISH | ||
| Normal | 25 | 24 |
| Complex/hyperdiploid and del 13 by cytogenetics | 4 | 1 |
| Hyperdiploid without deletions | 6 | 3 |
| FISH + chromosomes 13,14, or 17 | 3 | 3 |
| Del Y | 2 | 1 |
| Time to first auto HCT: median (range) months | 7 (3 - 60) | 7 (3 - 39) |
| Tandem autologous/autologous HCT | 5 | 4 |
| Tandem autologous/allogeneic HCT | 5 | 6 |
| Salvage autologous/autologous HCT | 4 | 1 |
| Salvage autologous/allogeneic HCT | 6 | 2 |
| Maintenance lenalidomide | 4 | 1 |
| Maintenance thalidomide/interferon | 5 | 6 |
| Characteristic | Group 5 (n = 14) | All Other Patients (n = 58) |
|---|---|---|
| Abbreviations: HCT: hematopoietic cell transplant; FISH: fluorescence in situ hybridization; ISS: international staging system. | ||
| Male/female | 5/9 | 34/24 |
| Age, median (range) years | 59 (47 - 75) | 56 (35 - 75) |
| Durie-Salmon stage | ||
| I A | 1 | 4 |
| II A | 7 | 14 |
| III A/IIIB | 3/3 | 33/7 |
| International staging system | ||
| I | 3 | 26 |
| II | 6 | 16 |
| III | 3 | 7 |
| missing | 2 | 9 |
| Lines of therapy before HCT | ||
| 1 | 10 | 38 |
| 2 | 3 | 13 |
| 3 | 1 | 7 |
| Cytogenetics/FISH | ||
| Normal | 11 | 38 |
| Complex/hyperdiploid and del 13 by cytogenetics | 0 | 5 |
| Hyperdiploid without deletions | 1 | 8 |
| FISH + chromosomes 13,14, or 17 | 2 | 4 |
| Del Y | 0 | 3 |
| Time to first autologous HCT: median (range) months | 6 (4 - 24) | 7 (3 - 60) |
| Tandem autologous/autologous HCT | 2 | 7 |
| Tandem autologous/allogeneic HCT | 5 | 6 |
| Salvage autologous/autologous HCT | 0 | 5 |
| Salvage autologous/allogeneic HCT | 0 | 8 |
| Maintenance lenalidomide | 0 | 5 |
| Maintenance thalidomide/interferon | 2 | 9 |
| Variable | Univariate | Multivariate | ||||
|---|---|---|---|---|---|---|
| Hazard ratio | 95% CI | P value | Hazard ratio | 95% CI | P value | |
| Abbreviations: DS: Durie-Salmon stage; ISS: International staging system; FISH: fluorescence in situ hybridization; Definitions of cytogenetics: 1-poor prognosis, complex abnormalities with del 13, 17p, or t(4:14), or any of these abnormalities; 2- Intermediate prognosis, normal chromosomes, Del 13 by FISH only; 3- Good prognosis, hyperdiploidy, t(11,14). | ||||||
| Disease stage DS | ||||||
| IIA vs IA | 0.884 | 0.292 - 2.675 | 0.8274 | 1.166 | 0.342 - 3.972 | 0.8058 |
| IIIA vs IA | 1.337 | 0.465 - 3.845 | 0.2898 | 1.722 | 0.575 - 5.157 | 0.3311 |
| IIIB vs IA | 1.439 | 0.420 - 4.930 | 0.3350 | 4.219 | 0.994 - 17.902 | 0.0509 |
| Disease stage ISS | ||||||
| II vs I | 1.467 | 0.800 - 2.692 | 0.2156 | 1.41 | 0.699 - 2.845 | 0.3376 |
| III vs I | 0.742 | 0.304 - 1.808 | 0.5110 | 0.533 | 0.189 - 1.508 | 0.2358 |
| Cytogenetics/FISH | ||||||
| 3 vs 1 | 1.178 | 0.496 - 2.797 | 0.7107 | 0.997 | 0.391 - 2.44 | 0.9598 |
| 2 vs 1 | 1.750 | 0.483 - 6.254 | 0.3894 | 2.411 | 0.638 - 9.109 | 0.1943 |
| Negative vs Positive conventional skeletal survey | 0.522 | 0.253 - 1.077 | 0.0784 | 0.396 | 0.172 - 0.910 | 0.0291 |
| Gender | ||||||
| Male vs Female | 0.998 | 0.577 - 1.726 | 0.9944 | 1.088 | 0.603 - 1.963 | 0.7795 |
| Age | 1.005 | 0.977 - 1.033 | 0.7452 | 1.005 | 0.973 - 1.039 | 0.7534 |
| Variable | Univariate | Multivariate | ||||
|---|---|---|---|---|---|---|
| Hazard ratio | 95% CI | P value | Hazard ratio | 95% CI | P value | |
| Abbreviations: DS: Durie-Salmon stage; ISS: International staging system; FISH: fluorescence in situ hybridization; Definitions of cytogenetics: 1- poor prognosis,complex abnormalities with del 13, 17p, or t(4:14), or any of these abnormalities; 2- Intermediate prognosis, normal chromosomes, Del 13 by FISH only; 3- good prognosis, hyperdiploidy, t(11,14). | ||||||
| Disease stage DS | ||||||
| IIA vs IA | 0.754 | 0.083 - 6.876 | 0.8026 | 1.27 | 0.111 - 14.485 | 0.8472 |
| IIIA vs IA | 2.116 | 0.275 - 16.264 | 0.4715 | 4.57 | 0.534 - 39.147 | 0.1655 |
| IIIB vs IA | 3.839 | 0.461 - 31.947 | 0.2133 | 11.972 | 1.196 - 116.23 | 0.0346 |
| Disease stage ISS | ||||||
| II vs I | 7.70 | 2.765 - 21.837 | 0.0001 | 7.234 | 2.179 - 24.015 | 0.0012 |
| III vs I | 4.579 | 1.321 - 15.872 | 0.0164 | 3.426 | 0.809 - 14.516 | 0.0946 |
| Cytogenetics/FISH | ||||||
| 3 vs 1 | 1.044 | 0.308 - 3.539 | 0.9452 | 0.26 | 0.058 - 1.154 | 0.0763 |
| 2 vs 1 | 1.089 | 0.181 - 6.54 | 0.9257 | 0.232 | 0.031 - 1.724 | 0.1532 |
| Negative vs Positive conventional skeletal survey | 0.136 | 0.018 - 1.01 | 0.051 | 0.061 | 0.007 - 0.554 | 0.013 |
| Gender Male vs Female | 0.803 | 0.358 - 1.798 | 0.593 | 0.875 | 0.37 - 2.069 | 0.761 |
| Age | 1.03 | 0.987 - 1.074 | 0.1809 | 1.047 | 0.987 - 1.111 | 0.126 |
| Groups of patients | Median PFS (months) | Median OS (months) | Hazard ratio | 95% confidence interval | P value |
|---|---|---|---|---|---|
| Abbreviations: Group 1: Patients who had more myelomatous bone disease detected on WBCT than CSS; Group 2: Patients without any differences between CSS and WBCT in the detection of myelomatous bone disease; Group 3: Patients without any myelomatous bone disease detected by either modality; Group 4: Patients with myelomatous bone lesions detected by WBCT but not by CSS; Group 5: patients in groups 3 and 4 together. | |||||
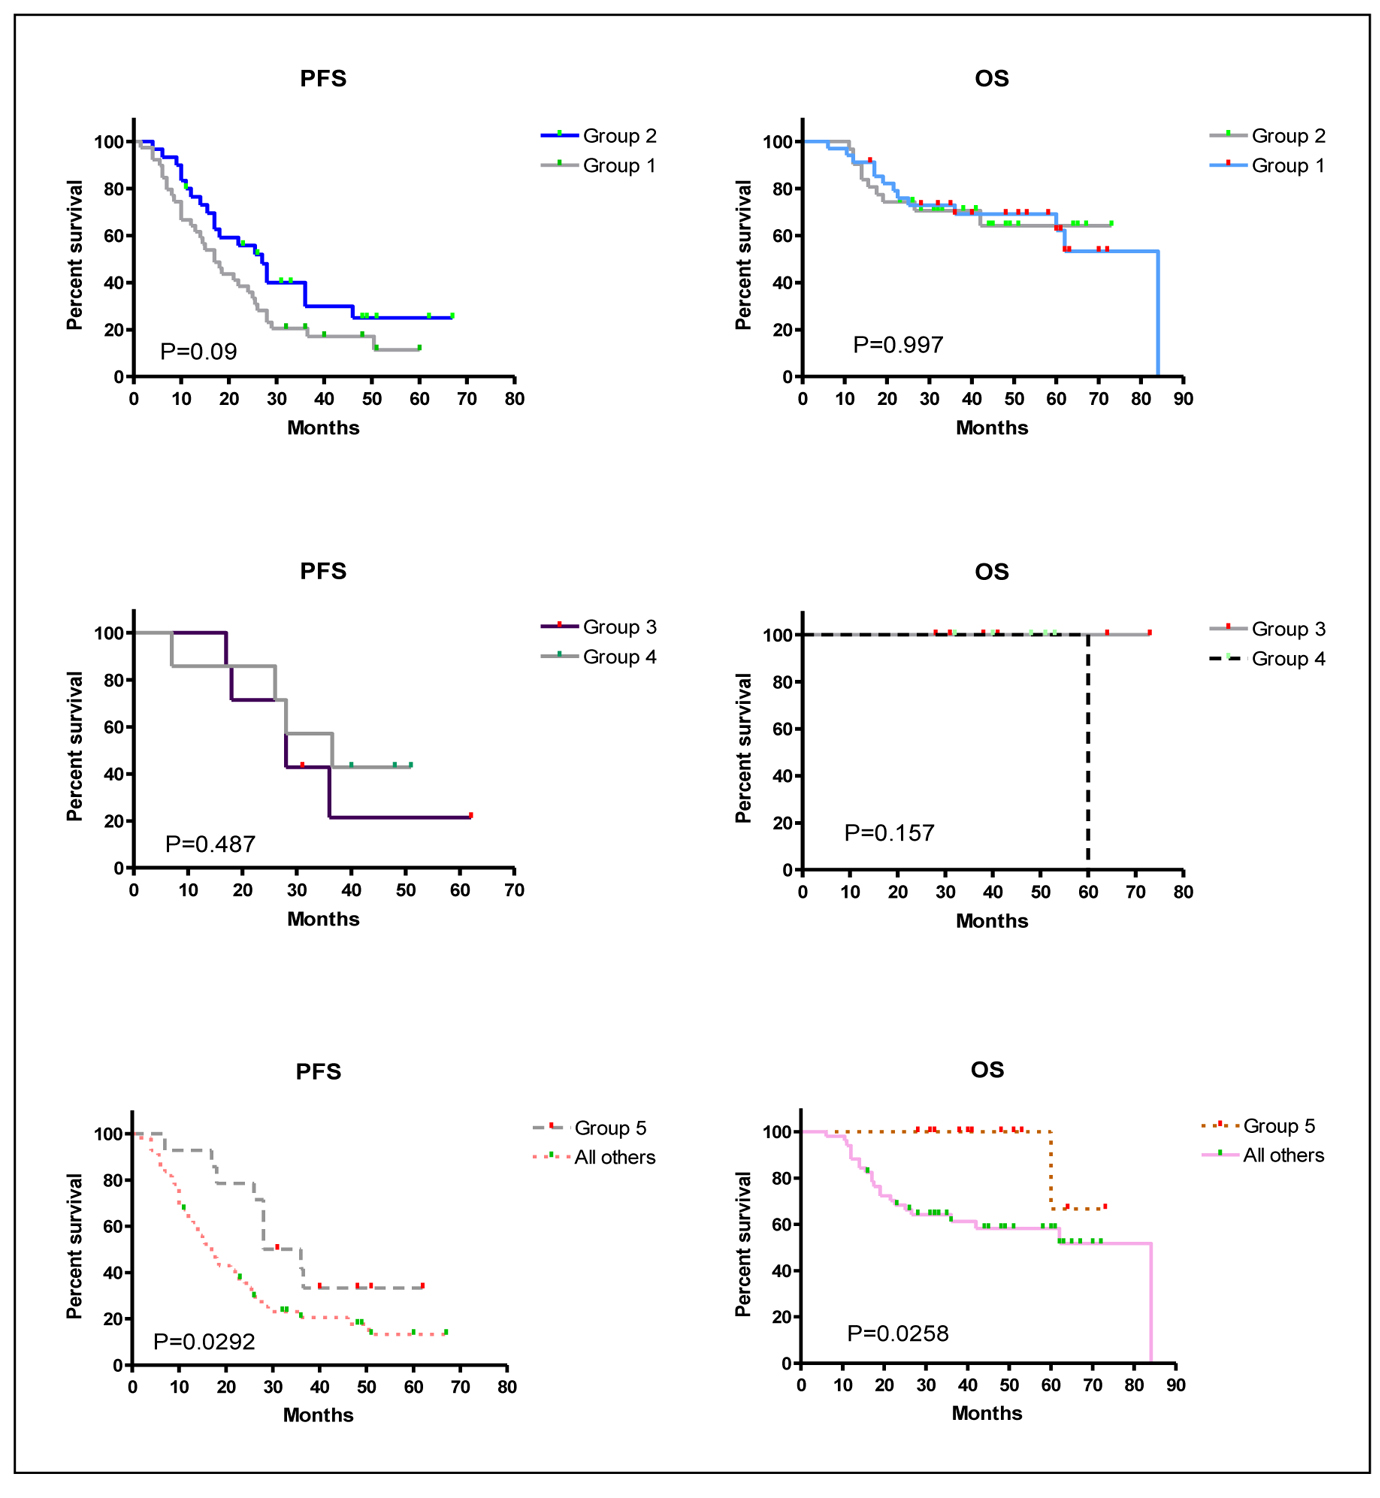
| Groups 1 vs. 2 | 17 vs. 27 | 84 vs. not yet reached | PFS: 0.627 OS 1.001 | PFS: 0.36 - 1.1 OS: 0.43 - 2.34 | PFS: 0.09 OS: 0.997 |
| Groups 3 vs. 4 | 28 vs. 36.5 | Not yet reached vs. 60 | PFS: 1.544 OS: 0.00 | PFS: 0.41 - 6.66 OS: 0.0008 - 3.18 | PFS: 0.487 OS: 0.157 |
| Groups 5 vs. all others | 32 vs. 17 | Not yet reached vs. 84 | PFS: 0.47 OS: 0.145 | PFS: 0.28 - 0.93 OS: 0.13 - 0.87 | PFS: 0.0292 OS: 0.0258 |