World Journal of Oncology, ISSN 1920-4531 print, 1920-454X online, Open Access
Article copyright, the authors; Journal compilation copyright, World J Oncol and Elmer Press Inc
Journal website http://www.wjon.org

Original Article

Volume 3, Number 4, August 2012, pages 173-181


Low-Dose Aspirin Therapy Does not Increase the Severity of Acute Radiation Proctitis

Figure

Figure 1.
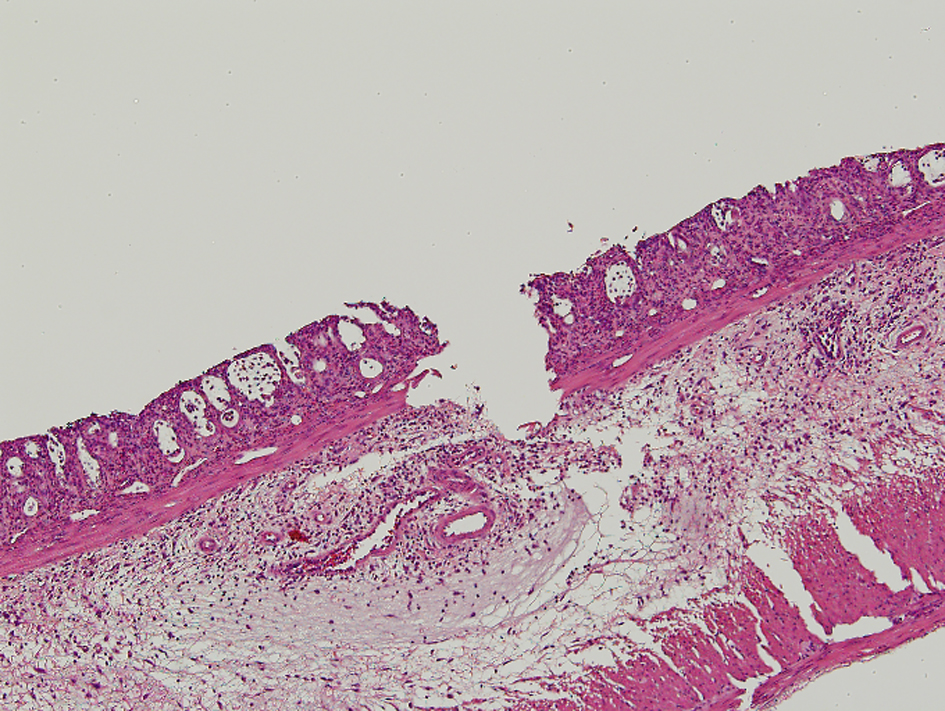
Figure 1. In the pathologic findings, crypt architectural distortion with inflammatory cells, loss of the columnar shape, and the submucosal edema were observed. The loss of epithelium reached submucosa through muscularis mucosa for Grade 4 in the morphological damage. The degree of inflammation was severe and corresponded to Grade 4.

Tables

Table 1. Grading of the Pathological Changes on Microscopic Examination
 
The Morphological Mucosal Damage
The severity of proctitis was evaluated pathologically regarding the morphological mucosal damage, the degree of inflammation, and the depth of inflammation. The results were graded from 0 to 4, and then were compared.
0 = Normal or minor alterations which could not be ascribed with certainly to radiation
1 = Slight crypt change without loss of epithelium
2 = Crypt change with loss of epithelium equaling less than one-half
3 = Crypt change with loss of epithelium greater than one-half
4 = Loss of epithelium through muscularis mucosa
The Degree of Inflammation
The severity of proctitis was evaluated pathologically regarding the morphological mucosal damage, the degree of inflammation, and the depth of inflammation. The results were graded from 0 to 4, and then were compared.
0 = Normal mucosa
1 = Minor alterations
2 = Apparent inflammation (mild inflammation)
3 = More significant inflammation (moderate inflammation)
4 = Severe inflammation.
The Depth of Inflammation
The severity of proctitis was evaluated pathologically regarding the morphological mucosal damage, the degree of inflammation, and the depth of inflammation. The results were graded from 0 to 4, and then were compared.
0 = No apparent inflammation
1 = Inflammatory cells extend up to edge of the mucosa (epithelium, lamina propria) but not beyond
2 = Inflammatory cells extend through the mucosa and into the submucosa
3 = Inflammatory cells infiltrate through submucosa and extends into muscularis propria
4 = Inflammatory cells extend through muscularis propria into subserosa.


Table 2. The Clinical and Macroscopic Findings
 
Clinical findings
Group (number)Grade 0Grade 1Grade 2Grade 3Grade 4
The results of the clinical and macroscopic findings are presented as numbers, with percentages in parentheses. There were no significant differences among the irradiated groups in either the clinical or the macroscopic findings.
ASA5 (n = 10)0 (0.0)1 (10.0)7 (70.0)2 (20.0)0 (0.0)
ASA10 (n = 10)0 (0.0)8 (80.0)1 (10.0)1 (10.0)0 (0.0)
ASA20 (n = 6)0 (0.0)1 (16.7)2 (33.3)2 (33.3)1 (16.7)
Saline (n = 6)0 (0.0)5 (83.3)0 (0.0)1 (16.7)0 (0.0)
RT-/ASA20 (n = 7)7 (100.0)0 (0.0)0 (0.0)0 (0.0)0 (0.0)
ComparisonP-valueComparisonP-value
The results of the clinical and macroscopic findings are presented as numbers, with percentages in parentheses. There were no significant differences among the irradiated groups in either the clinical or the macroscopic findings.
ASA5 vs. ASA100.61ASA10 vs. ASA200.12
ASA5 vs. ASA200.30ASA10 vs. Saline1.00
ASA5 vs. Saline1.00ASA20 vs. Saline0.30
Macroscopic findings
Group (number)Grade 0Grade 1Grade 2Grade 3Grade 4
The results of the clinical and macroscopic findings are presented as numbers, with percentages in parentheses. There were no significant differences among the irradiated groups in either the clinical or the macroscopic findings.
ASA5 (n = 10)0 (0.0)0 (0.0)8 (80.0)2 (10.0)0 (0.0)
ASA10 (n = 10)0 (0.0)5 (50.0)5 (50.0)0 (0.0)0 (0.0)
ASA20 (n = 6)0 (0.0)2 (33.3)3 (50.0)1 (16.7)0 (0.0)
Saline (n = 6)0 (0.0)2 (33.3)3 (50.0)1 (16.7)0 (0.0)
RT-/ASA20 (n = 7)2 (28.6)2 (28.6)3 (42.9)0 (0.0)0 (0.0)
ComparisonP-valueComparisonP-value
The results of the clinical and macroscopic findings are presented as numbers, with percentages in parentheses. There were no significant differences among the irradiated groups in either the clinical or the macroscopic findings.
ASA5 vs. ASA100.24ASA10 vs. ASA200.38
ASA5 vs. ASA201.00ASA10 vs. Saline0.38
ASA5 vs. Saline1.00ASA20 vs. Saline1.00


Table 3. The Pathological Findings
 
Morphological mucosal damage
Group (number)Grade 0Grade 1Grade 2Grade 3Grade 4
The results of the pathological findings are presented as numbers, with percentages in parentheses. There were no significant differences among the irradiated groups in the morphological mucosal damage and in the depth of inflammation. Whereas, significant differences were observed between the ASA20 group and the other irradiated groups in the degree of inflammation.
ASA5 (n = 10)0 (0.0)0 (0.0)3 (30.0)2 (20.0)5 (50.0)
ASA10 (n = 7)0 (0.0)0 (0.0)2 (28.6)3 (42.9)2 (28.6)
ASA20 (n = 6)0 (0.0)0 (0.0)3 (50.0)0 (0.0)3 (50.0)
Saline (n = 5)0 (0.0)0 (0.0)1 (20.0)1 (20.0)3 (60.0)
RT-/ASA20 (n = 7)7 (100.0)0 (0.0)0 (0.0)0 (0.0)0 (0.0)
ComparisonP-valueComparisonP-value
The results of the pathological findings are presented as numbers, with percentages in parentheses. There were no significant differences among the irradiated groups in the morphological mucosal damage and in the depth of inflammation. Whereas, significant differences were observed between the ASA20 group and the other irradiated groups in the degree of inflammation.
ASA5 vs. ASA101.00ASA10 vs. ASA200.59
ASA5 vs. ASA200.61ASA10 vs. Saline1.00
ASA5 vs. Saline1.00ASA20 vs. Saline0.55
Degree of inflammation
Group (number)Grade 0Grade 1Grade 2Grade 3Grade 4
The results of the pathological findings are presented as numbers, with percentages in parentheses. There were no significant differences among the irradiated groups in the morphological mucosal damage and in the depth of inflammation. Whereas, significant differences were observed between the ASA20 group and the other irradiated groups in the degree of inflammation.
ASA5 (n = 10)0 (0.0)0 (0.0)1 (10.0)8 (80.0)1 (10.0)
ASA10 (n = 7)0 (0.0)0 (0.0)0 (0.0)3 (42.9)4 (57.1)
ASA20 (n = 6)0 (0.0)0 (0.0)5 (83.3)1 (16.7)0 (0.0)
Saline (n = 5)0 (0.0)0 (0.0)0 (0.0)2 (40.0)3 (60.0)
RT-/ASA20 (n = 7)6 (85.7)1 (14.3)0 (0.0)0 (0.0)0 (0.0)
ComparisonP-valueComparisonP-value
The results of the pathological findings are presented as numbers, with percentages in parentheses. There were no significant differences among the irradiated groups in the morphological mucosal damage and in the depth of inflammation. Whereas, significant differences were observed between the ASA20 group and the other irradiated groups in the degree of inflammation.
ASA5 vs. ASA101.00ASA10 vs. ASA200.0047
ASA5 vs. ASA200.0076ASA10 vs. Saline(avaluative)
ASA5 vs. Saline1.00ASA20 vs. Saline0.015
Depth of inflammation
Group (number)Grade 0Grade 1Grade 2Grade 3Grade 4
The results of the pathological findings are presented as numbers, with percentages in parentheses. There were no significant differences among the irradiated groups in the morphological mucosal damage and in the depth of inflammation. Whereas, significant differences were observed between the ASA20 group and the other irradiated groups in the degree of inflammation.
ASA5 (n = 10)0 (0.0)0 (0.0)8 (80.0)0 (0.0)2 (20.0)
ASA10 (n = 7)0 (0.0)0 (0.0)3 (42.9)0 (0.0)4 (57.1)
ASA20 (n = 6)0 (0.0)0 (0.0)6 (100.0)0 (0.0)0 (0.0)
Saline (n = 5)0 (0.0)0 (0.0)2 (40.0)0 (0.0)3 (60.0)
RT-/ASA20 (n = 7)7 (100.0)0 (0.0)0 (0.0)0 (0.0)0 (0.0)
ComparisonP-valueComparisonP-value
The results of the pathological findings are presented as numbers, with percentages in parentheses. There were no significant differences among the irradiated groups in the morphological mucosal damage and in the depth of inflammation. Whereas, significant differences were observed between the ASA20 group and the other irradiated groups in the degree of inflammation.
ASA5 vs. ASA100.16ASA10 vs. ASA200.070
ASA5 vs. ASA200.50ASA10 vs. Saline1.00
ASA5 vs. Saline0.25ASA20 vs. Saline0.061