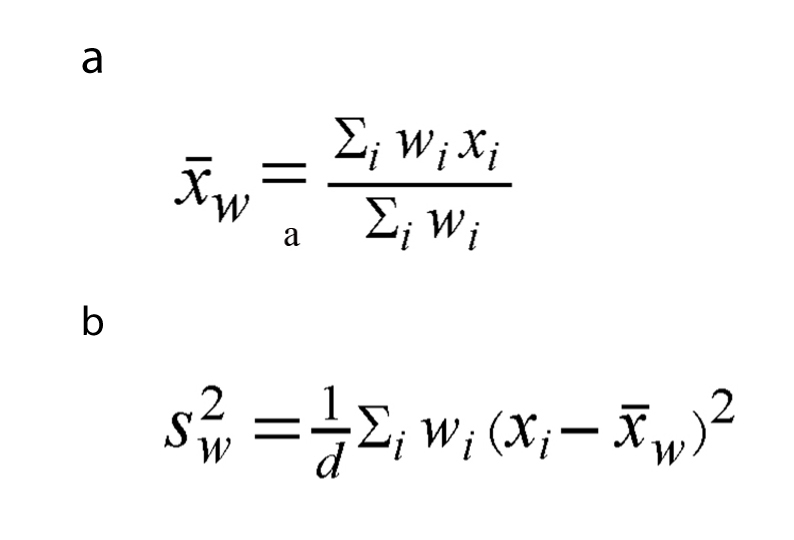
Figure 1. The weighted mean (a) and the weighted variance (b), wi is the weight for the ith study, xi is the ith variable value, and the variance divisor d is n-1.
| World Journal of Oncology, ISSN 1920-4531 print, 1920-454X online, Open Access |
| Article copyright, the authors; Journal compilation copyright, World J Oncol and Elmer Press Inc |
| Journal website http://www.wjon.org |
Review
Volume 4, Number 1, February 2013, pages 8-17
Quality of Life in Patients with Advanced Cancer Using the Functional Assessment of Cancer Therapy-General Assessment Tool: A Literature Review
Figure
Tables
| Parameter | No. (%) |
|---|---|
| Purpose of Study (n = 33) | |
| Assess Quality of Life | 13 (39.4%) |
| Establish Reliability of External Assessment Tool | 10 (30.3%) |
| Determine Determinants of Quality of Life | 7 (21.2%) |
| Establish Reliability of the FACT-G | 3 (9.1%) |
| Primary Cancer (n = 33) | |
| Heterogeneous | 12 (36.4%) |
| Lung | 7 (21.2%) |
| Head and Neck | 4 (12.1%) |
| Prostate | 2 (6.1%) |
| Breast | 2 (6.1%) |
| Other | 6 (18.2%) |
| Country of Study (n = 32) | |
| United States | 17 (51.5%) |
| Canada | 3 (9.1%) |
| Japan | 3 (9.1%) |
| China | 3 (9.1%) |
| Australia | 1 (3.0%) |
| India | 1 (3.0%) |
| Philippines | 1 (3.0%) |
| South Korea | 1 (3.0%) |
| Sweden | 1 (3.0%) |
| Uruguay | 1 (3.0%) |
| Parameter | No. (%) |
|---|---|
| Gender (n = 38) | |
| ≤ 50% Male | 16 (42.1%) |
| > 50% Male | 22 (57.9%) |
| Mean Age, years (n = 25) | |
| < 49 | 2 (8.0%) |
| 50 - 59 | 12 (48.0%) |
| 60 - 69 | 11 (44.0%) |
| Marital Status (n = 14) | |
| 50-70% Married | 5 (35.7%) |
| > 70% Married | 9 (64.3%) |
| High School Education (n = 10) | |
| ≤ 50% Completed High School | 4 (40.0%) |
| > 50% Completed High School | 6 (60.0%) |
| College/University Education (n = 11) | |
| ≤ 50% Completed College/University | 8 (72.7%) |
| > 50% Completed College/University | 3 (27.3%) |
| Admittance Status (n = 17) | |
| Purely Inpatients | 1 (5.9%) |
| Purely Outpatients | 11 (64.7%) |
| Both Inpatients and Outpatients | 5 (29.4%) |
| Median Survival (n = 11) | |
| ≤ Six Months | 4 (36.4%) |
| > Six Months | 7 (63.6%) |
| Median ECOG Performance Status (n = 15) | |
| 0 | 2 (13.3%) |
| 1 | 12 (80.0%) |
| 2 | 1 (6.7%) |
| Previous Chemotherapy (n = 26) | |
| ≤ 50% | 6 (23.1%) |
| > 50% | 20 (76.9%) |
| Previous Radiation Therapy (n = 16) | |
| ≤ 50% | 11 (68.8%) |
| > 50% | 5 (31.3%) |
| Previous Surgery (n = 14) | |
| ≤ 50% | 6 (42.9%) |
| > 50% | 8 (57.1%) |
| FACT-G | Categories | Sum of Weight | Weighted Mean (SD) | P-value | |
|---|---|---|---|---|---|
| * There are only 6 study arms with available information for the relationship with doctors subscale. NA: not available for calculation. SD: standard deviation. | |||||
| Physical Well-being | |||||
| Country | High Healthcare Cost | 3325 | 19.93 (28.47) | 0.0110 | |
| Low Healthcare Cost | 1039 | 16.87 (43.54) | |||
| Emotional Well-being | |||||
| Admittance Status | Mixed | 889 | 13.30 (46.28) | 0.0434 | |
| Outpatient | 1816 | 16.59 (27.35) | |||
| % Completing College/University | ≤ 30% | 736 | 15.10 (28.15) | 0.0398 | |
| > 30% | 717 | 17.66 (8.06) | |||
| Social/Family Well-being | |||||
| Country | High Healthcare Cost | 3446 | 22.06 (31.17) | 0.0164 | |
| Low Healthcare Cost | 834 | 18.51 (35.72) | |||
| > 75% | 1532 | 20.73 (41.45) | |||
| FACT-G Total Scale (Excluding Relationship with Doctor Subscale) | |||||
| Admittance Status | Mixed | 889 | 62.60 (135.80) | 0.0071 | |
| Outpatient | 1945 | 75.58 (63.68) | |||
| % Completing College/University | ≤ 30% | 1126 | 69.60 (103.36) | 0.0477 | |
| > 30% | 717 | 78.49 (41.66) | |||
| Relationship with Doctor* | |||||
| Country | High Healthcare Cost | 419 | 7.27 (1.21) | 0.0111 | |
| Low Healthcare Cost | 66 | 6.60 (NA) | |||
| % Receiving Previous Radiation Therapy | ≤ 25% | 222 | 7.30 (0.00) | < 0.0001 | |
| > 25% | 47 | 7.10 (NA) | |||