World Journal of Oncology, ISSN 1920-4531 print, 1920-454X online, Open Access
Article copyright, the authors; Journal compilation copyright, World J Oncol and Elmer Press Inc
Journal website http://www.wjon.org

Original Article

Volume 4, Number 2, April 2013, pages 74-82


Diagnostic Accuracy of Imaging Modalities in the Evaluation of Vascular Invasion in Pancreatic Adenocarcinoma: A Meta-Analysis

Figures

Figure 1.
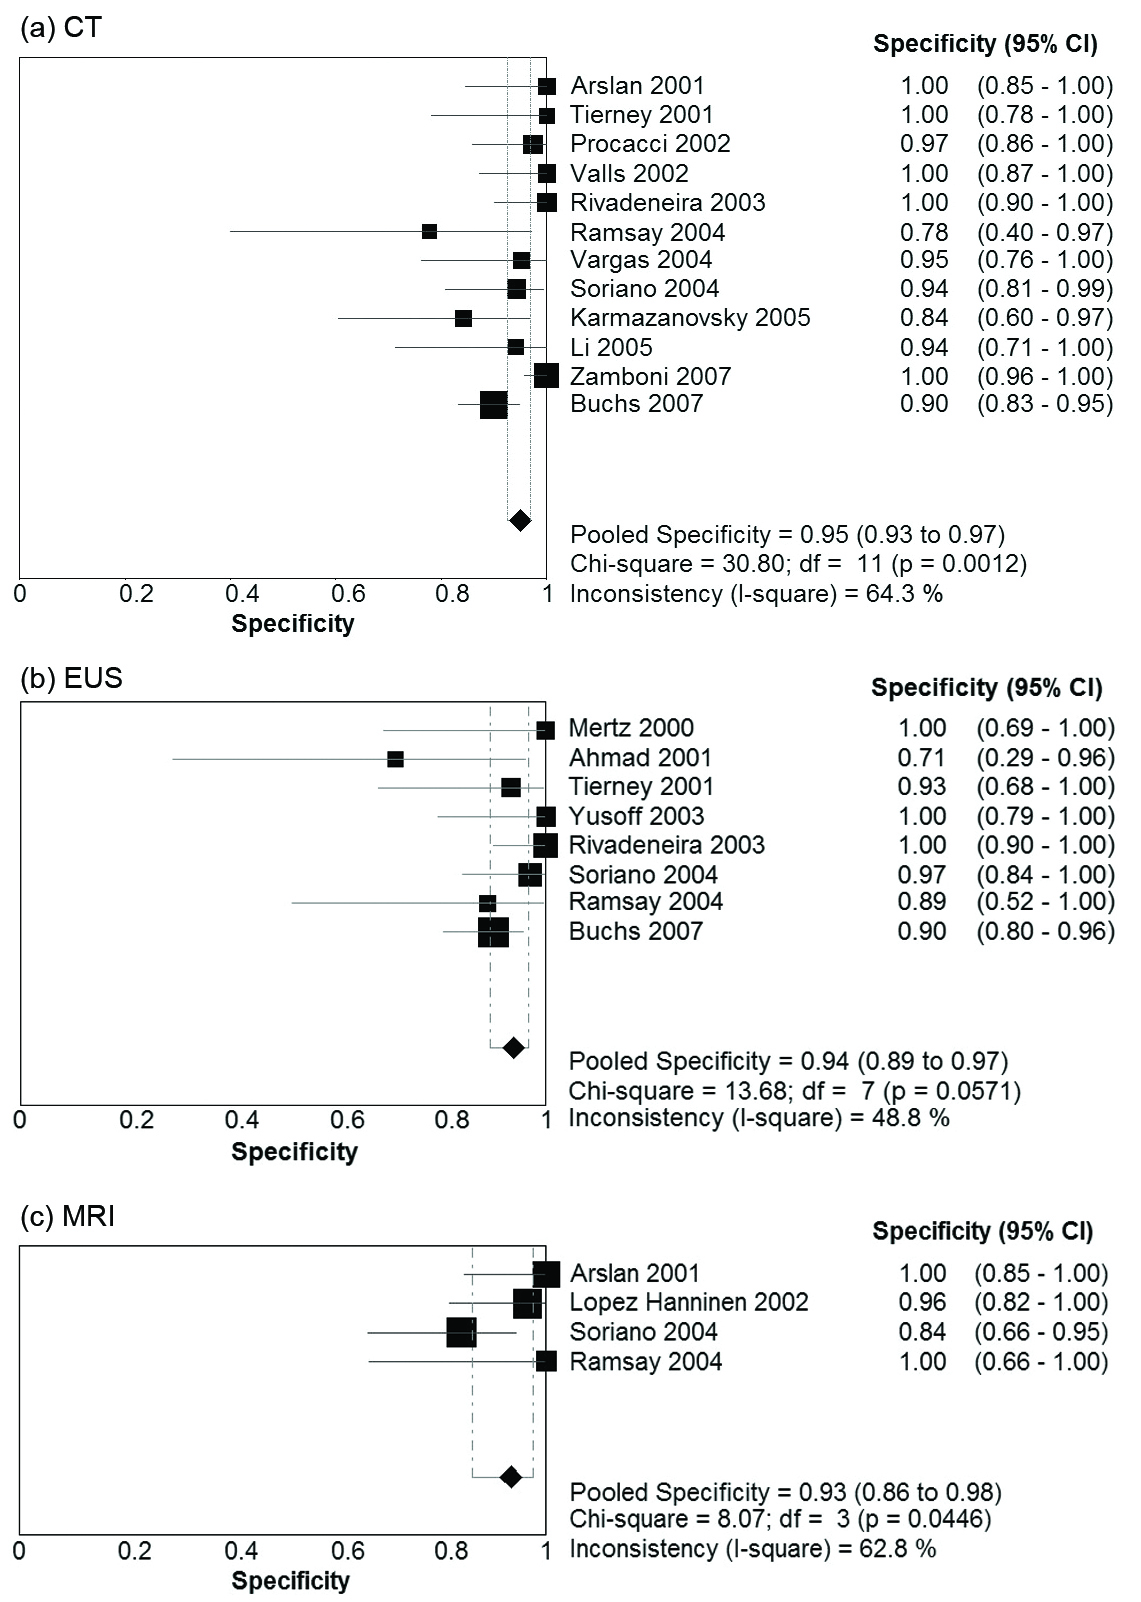
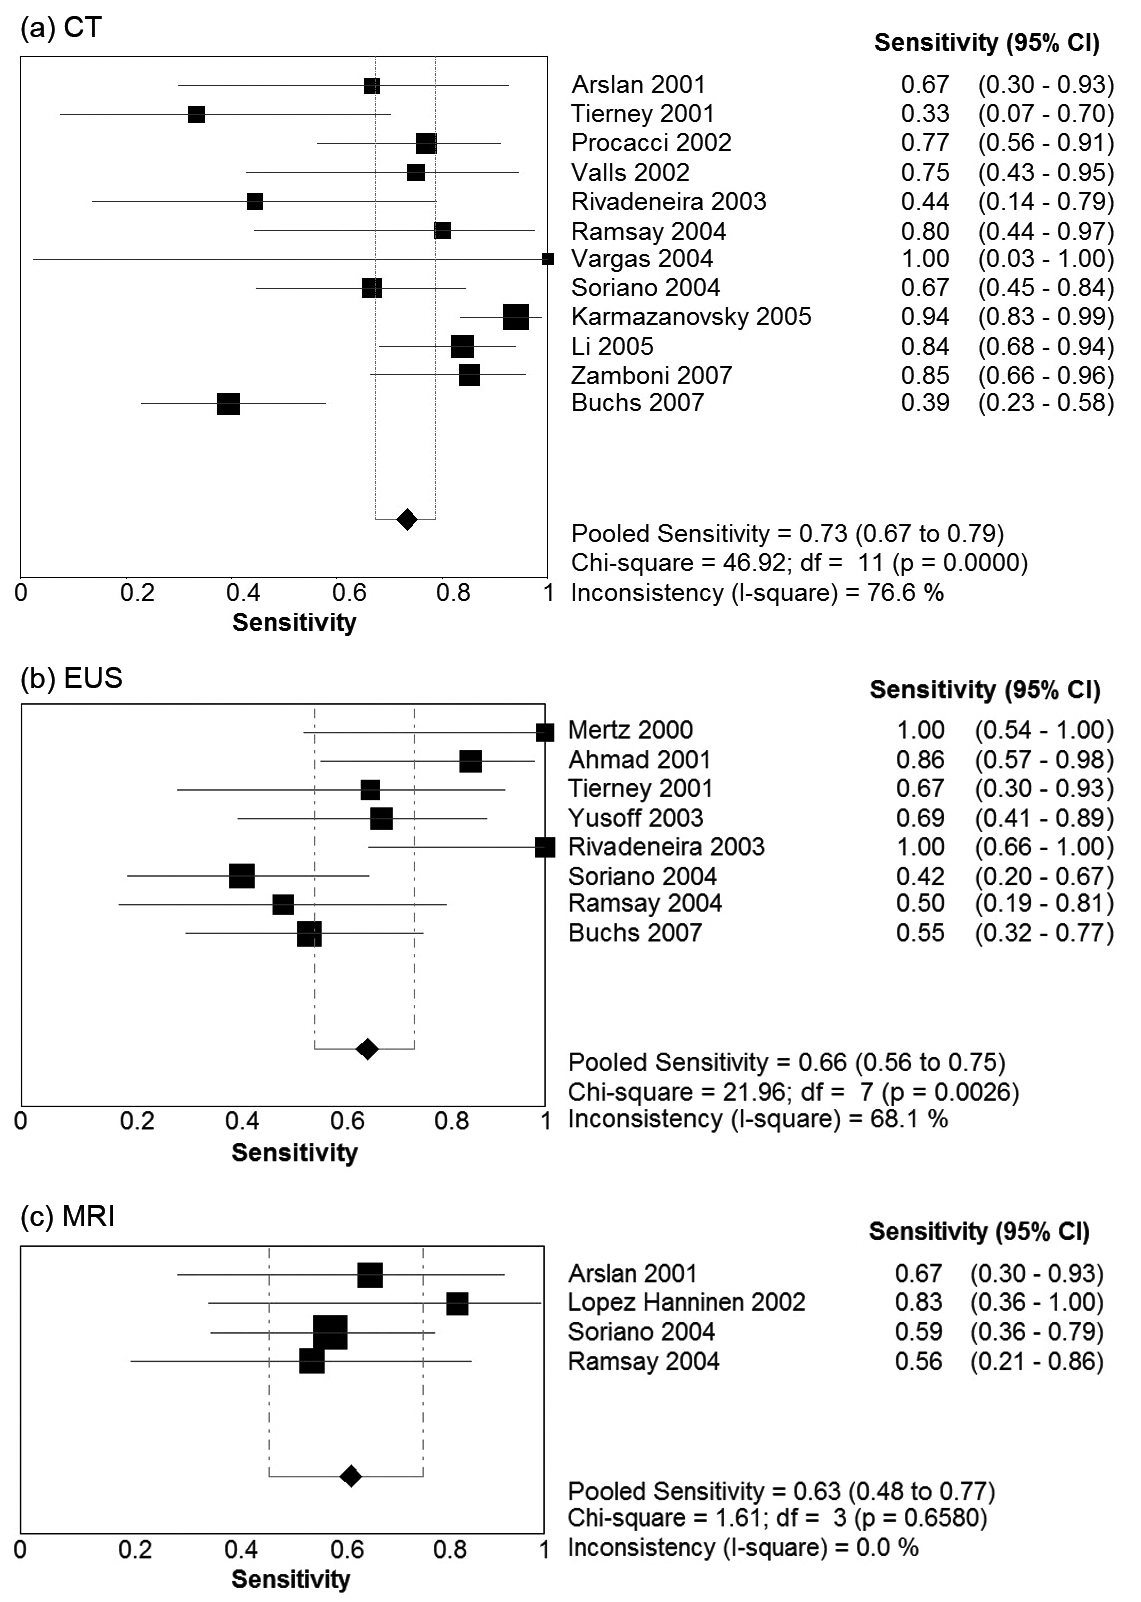
Figure 1. Forest plots of sensitivity Pooled results for sensitivity of (a) CT, (b) EUS, and (c) MRI in detection of vascular invasion in pancreatic adenocarcinoma. The limits of the diamond represent the 95% confidence interval of the pooled estimate.
Figure 2.
Figure 2. Forest Plots of specificity Pooled results for specificity of (a) CT, (b) EUS, and (c) MRI in detection of vascular invasion in pancreatic adenocarcinoma. The limits of the diamond represent the 95% confidence interval of the pooled estimate.

Tables

Table 1. Characteristics of Included Studies
 
YearStudy designPatients (n)Mean age (years)Males (%)Modality
n: number of patients who had surgical staging; NS: not specified; P: prospective; R: retrospective.
Mertz [12]2000P16NSNSEUS
Ahmad [21]2001P216176EUS
Arslan [22]2001R316348CT, MRI
Tierney [13]2001P246457CT, EUS
Lopez Hanninen [23]2002P345855MRI
Procacci [24]2002R636459CT
Valls [25]2002P396162CT
Rivadeneira [26]2003R446258CT, EUS
Yusoff [27]2003R326062EUS
Ramsay [28]2004P195744CT, EUS, MRI
Soriano [29]2004P596553CT, EUS, MRI
Vargas [30]2004R256452CT
Karmazanovsky [31]2005R696058CT
Li [32]2005P546167CT
Buchs [33]2007R153NS49CT, EUS
Zamboni [34]2007R1147046CT


Table 2. Estimates of Diagnostic Accuracy
 
No. StudiesSensitivity (95% CI)Specificity (95% CI)LR+ (95% CI)LR- (95% CI)DOR (95% CI)AUC (SE)Q*
CI: confidence interval; LR+: positive likelihood ratio; LR-: negative likelihood ratio; DOR: diagnostic odds ratio; AUC: area under the curve; SE: standard error; Q*: Cochran’s Q point; the point on the SROC curve where sensitivity equals specificity.
CT120.73 (0.67 - 0.79)0.95 (0.93 - 0.97)10.41 (5.50 - 19.70)0.31 (0.21 - 0.48)45.94 (17.98 - 117.40)0.93 (0.04)0.87
EUS80.66 (0.56 - 0.75)0.94 (0.85 - 0.97)7.02 (3.78 - 13.06)0.42 (0.29 - 0.61)23.03 (9.37 - 56.61)0.89 (0.05)0.82
MRI40.63 (0.48 - 0.77)0.93 (0.86 - 0.98)8.88 (2.74 - 28.79)0.44 (0.30 - 0.63)23.89 (5.43 - 105.09)0.65 (0.21)0.62


Table 3. Subgroup Analysis: Single Slice CT Compared to MDCT
 
No. StudiesSensitivity (95% CI*)Specificity (95% CI)DOR (95% CI)
CI: confidence interval; DOR: diagnostic odds ratio.
Single slice CT90.70 (0.63 - 0.77)0.94 (0.91 - 0.97)32.21 (11.5 - 90.2)
MDCT40.80 (0.70 - 0.89)0.97 (0.93 - 1.00)65.1 (9.89 - 428.88)