Figures
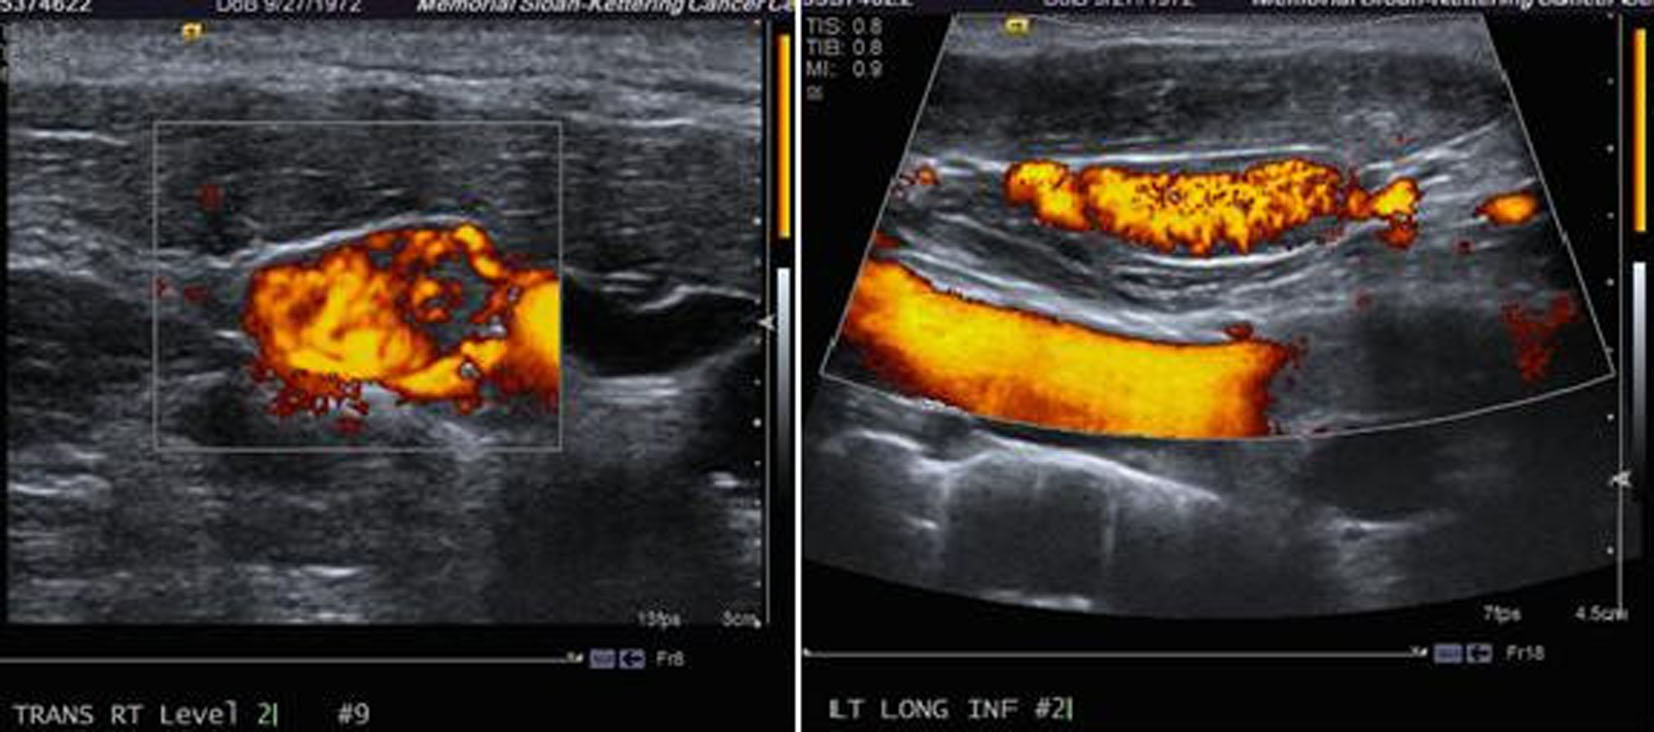
Figure 1. Ultrasound of the neck showing a thyroid mass suspicious of malignancy.
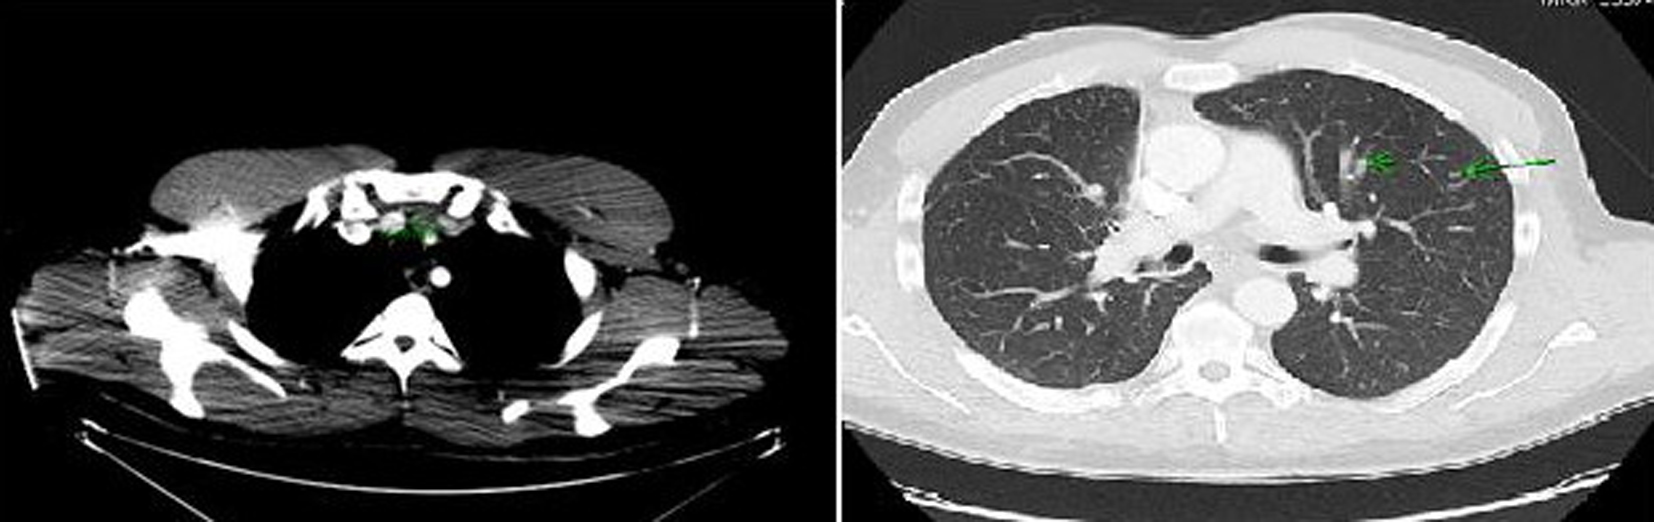
Figure 2. Computer tomography of the neck and chest showing a mass arising in the isthmus of thyroid gland and multiple pulmonary nodules in both lung fields.
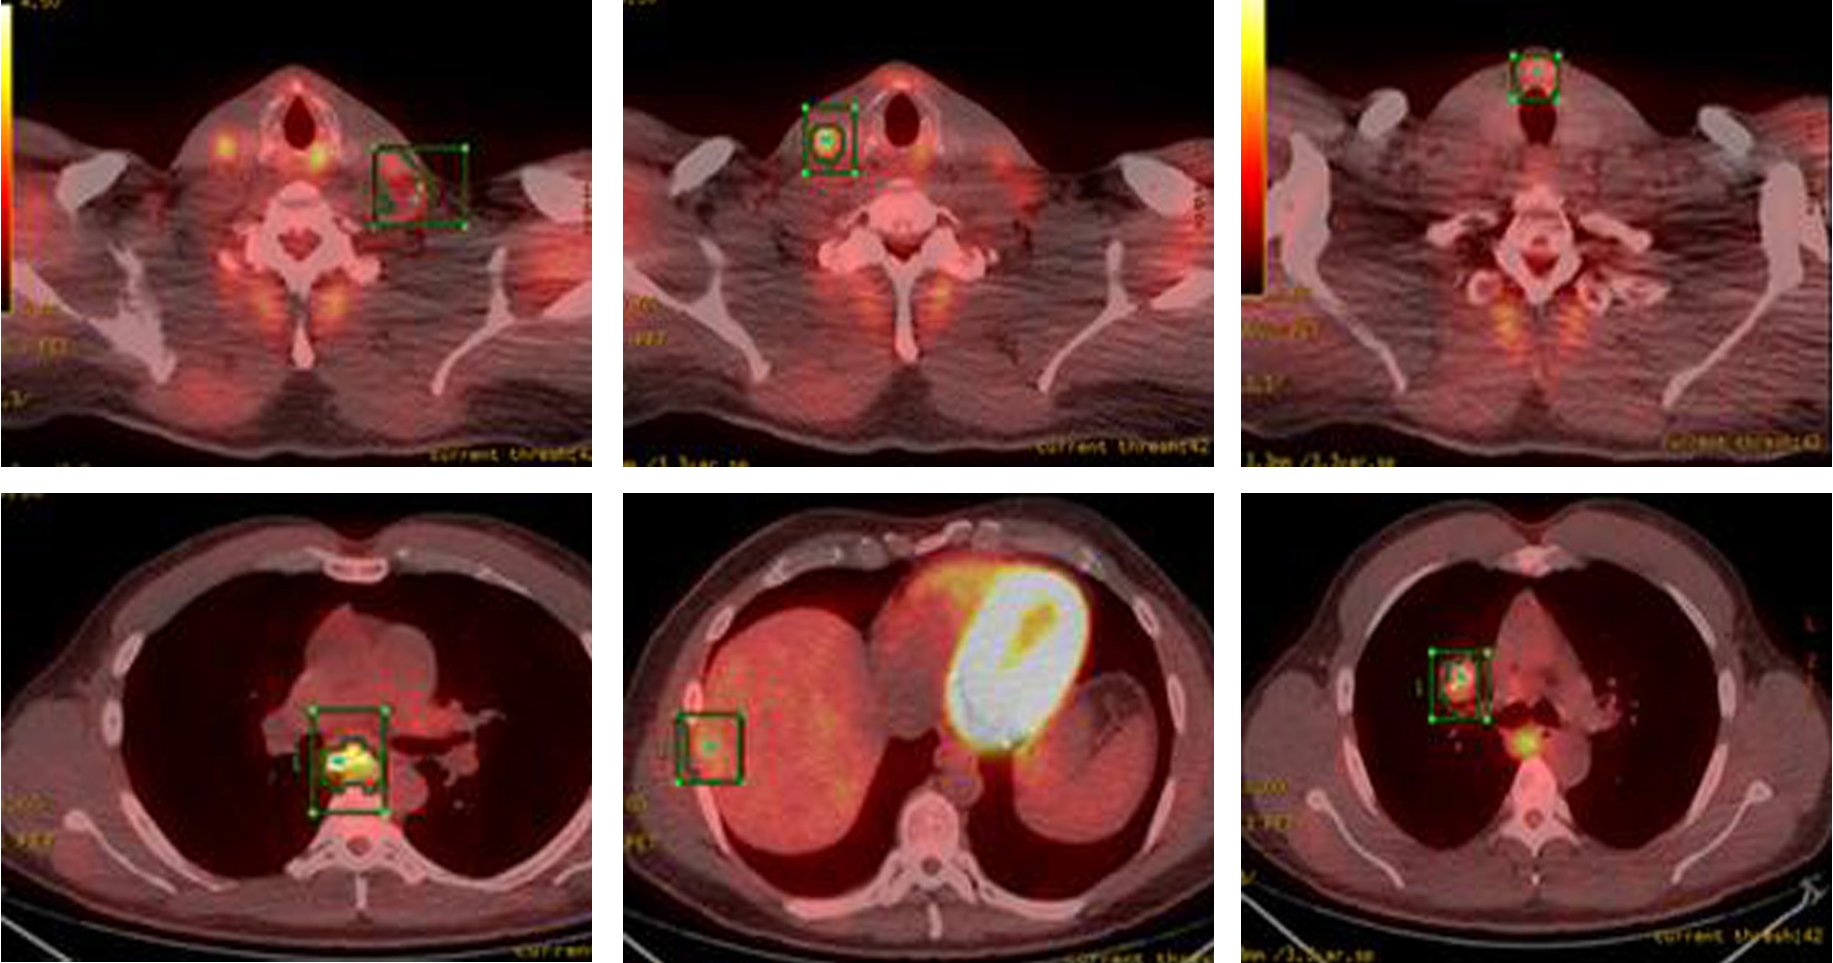
Figure 3. PET-CT showing FDG-avid nodular lesion in the thyroid isthmus, multiple bilateral cervical nodes, calcified mediastinal and hilar mass, patchy uptake in liver and sclerotic changes in skeleton suspicious for osseous metastasis.
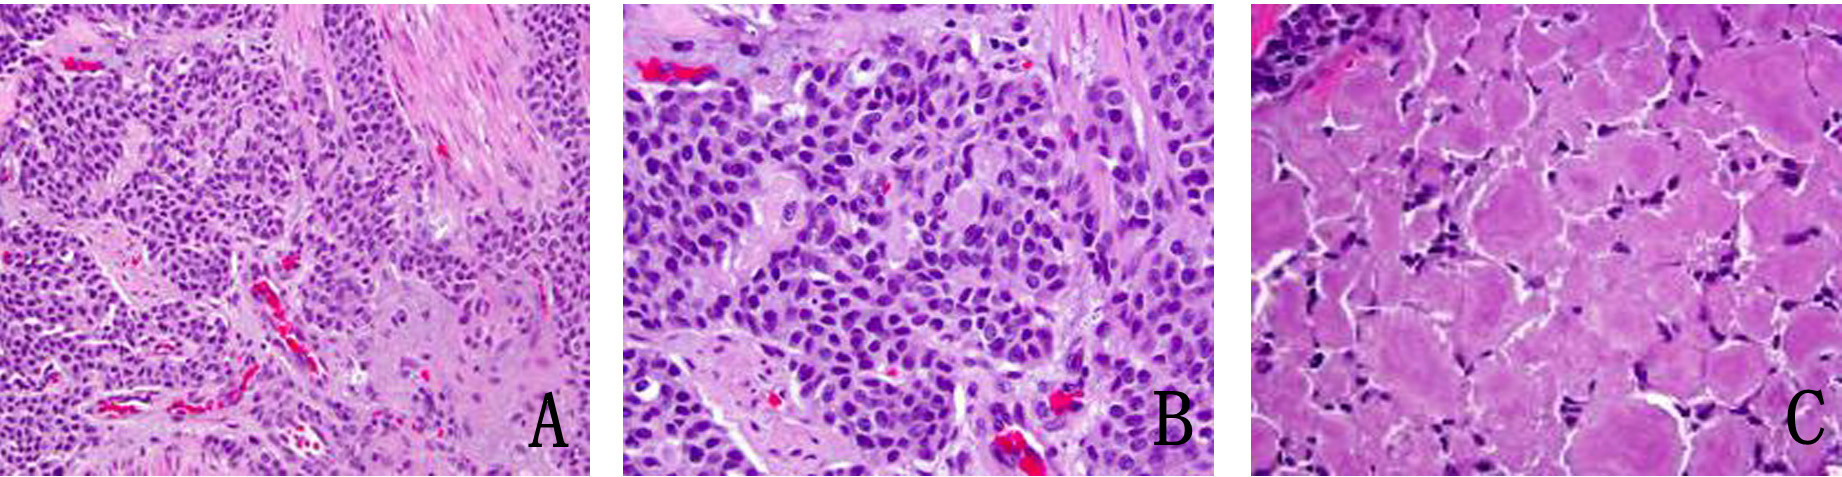
Figure 4. (A) Metastatic medullary carcinoma in the lung, under respiratory epithelium (× 40). (B) Higher power of metastatic medullary carcinoma in the lung (× 60). (C) Amyloid deposition in metastatic medullary carcinoma in the lung (× 60).
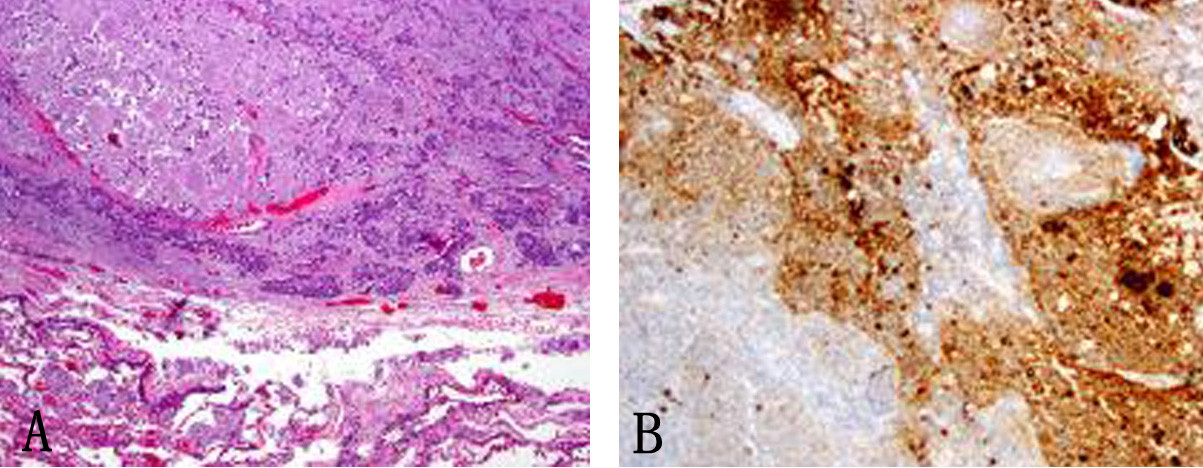
Figure 5. (A) Subcarinal lymph nodes positive for metastatic disease (× 40). (B) Synaptophysin stain on lymph node metastatis (× 40).
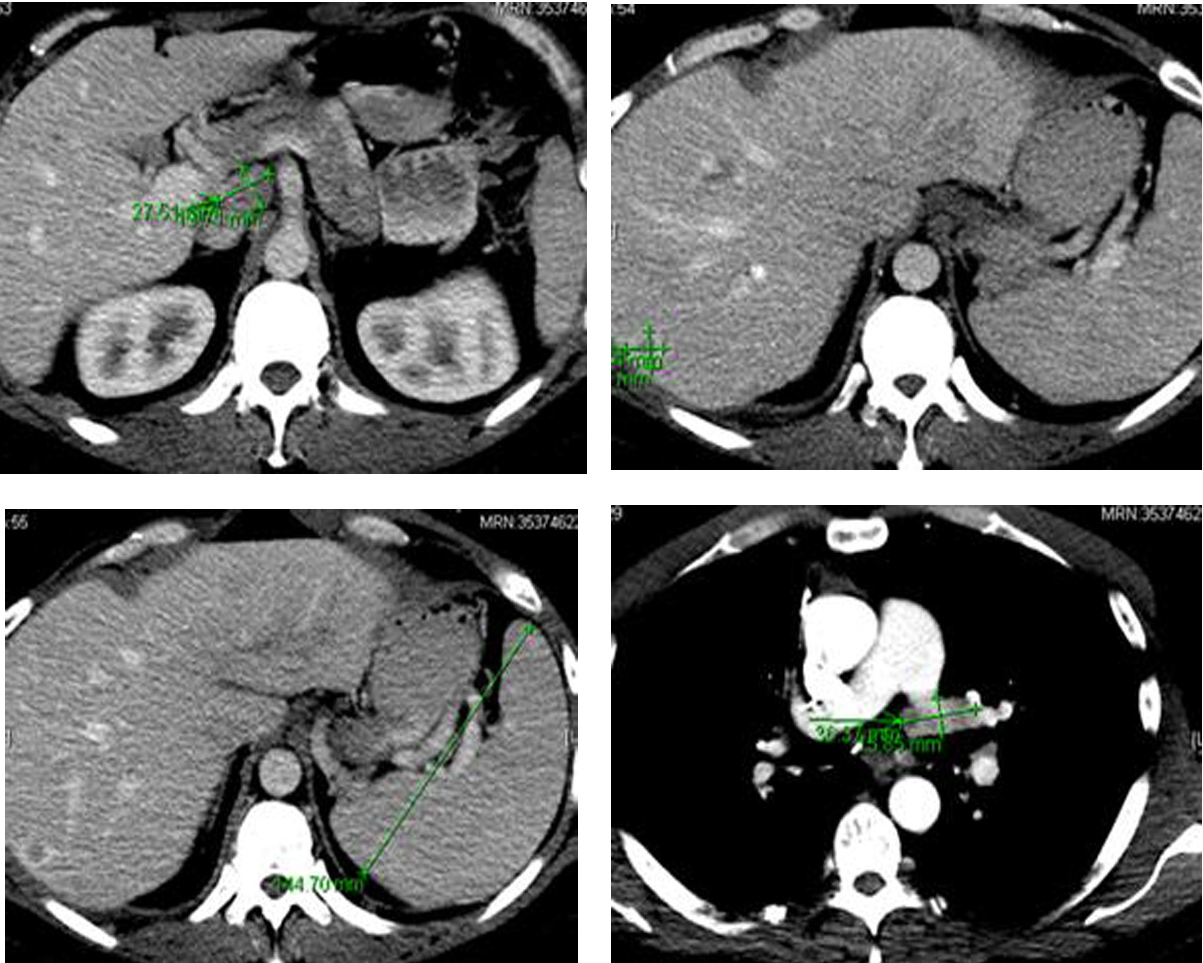
Figure 6. Computer tomography of the abdomen showing several hepatic metastasis, splenomegaly and abdominal adenopathy.
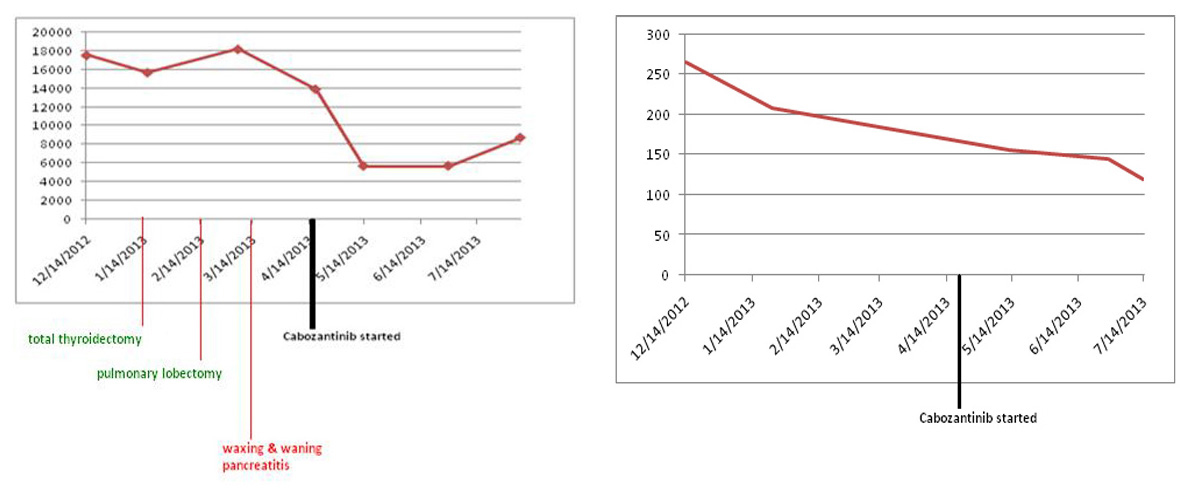
Figure 7. Both serum calcitonin and CEA levels following cabozantinib therapy. Y axis: serum calcitonin levels pg/mL; Y axis: serum CEA levels ng/mL.
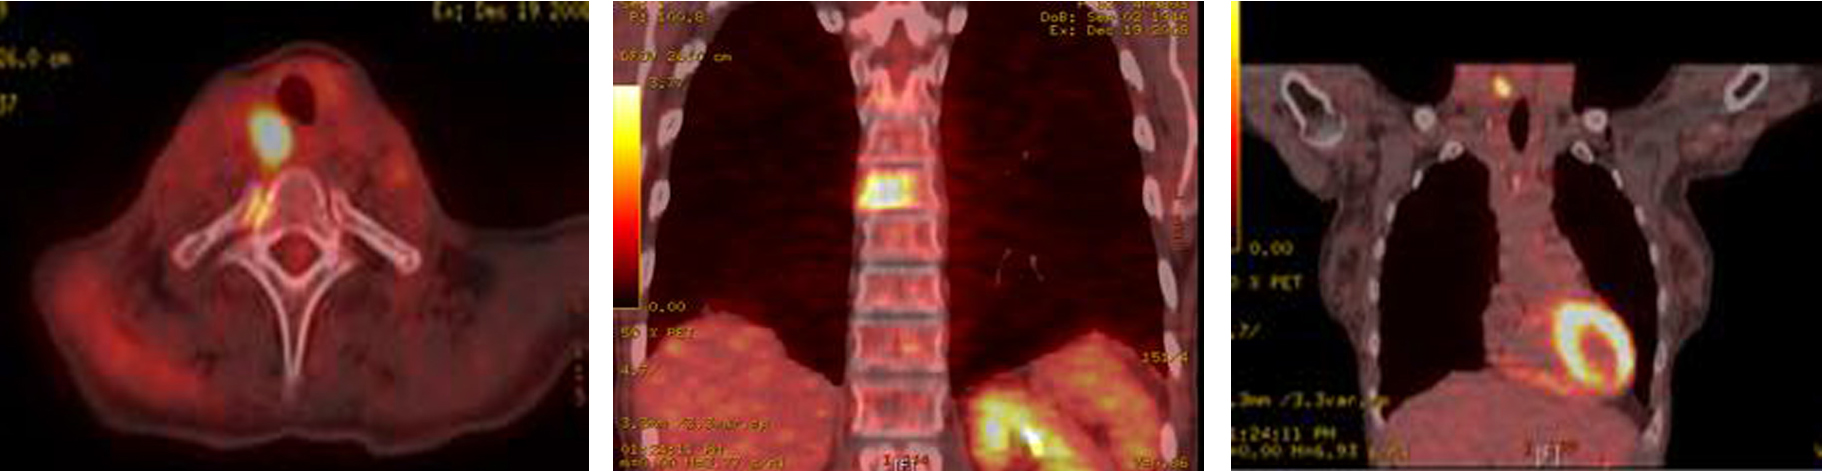
Figure 8. PET-CT showing extensive metastatic disease involving the spine.
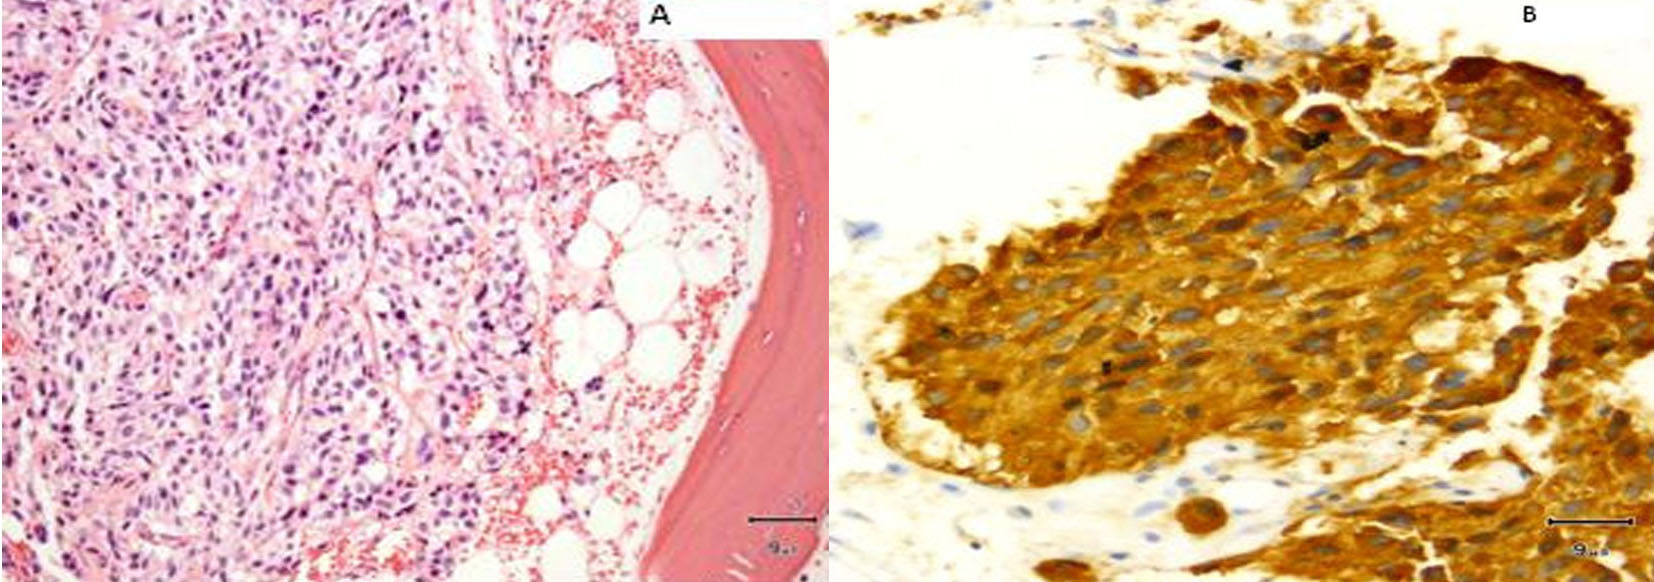
Figure 9. (A) Vertebral biopsy showing metastatic medullary thyroid carcinoma. (B) Synaptophysin stain on vertebral metastasis.
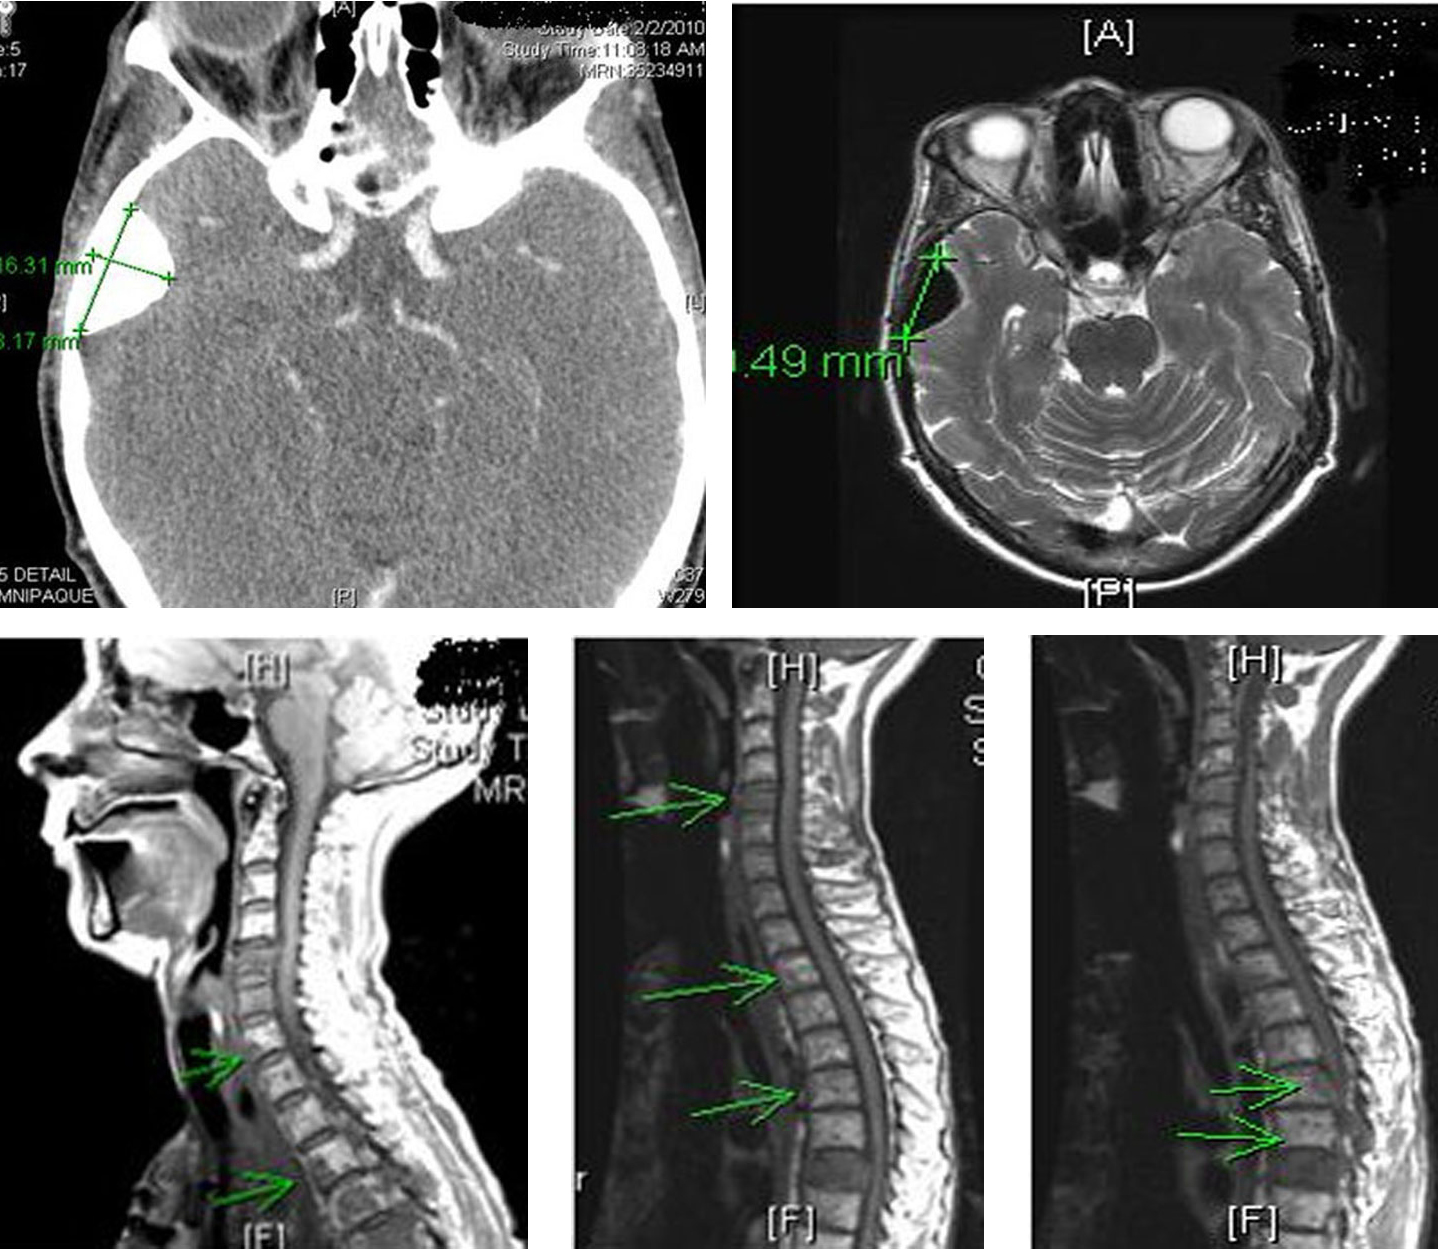
Figure 10. Computer tomography of the head and spine region showing left orbital metastasis and worsening spinal metastasis.
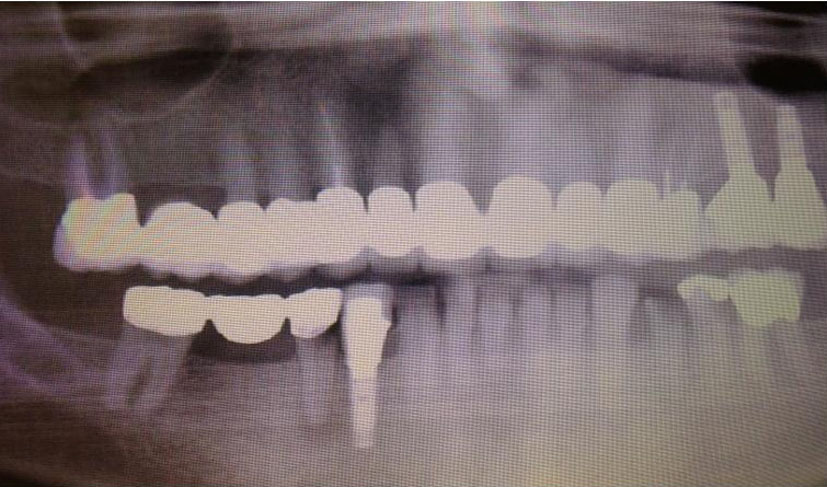
Figure 11. Osteonecrosis of the jaw (ONJ) secondary to bisphosphonates.
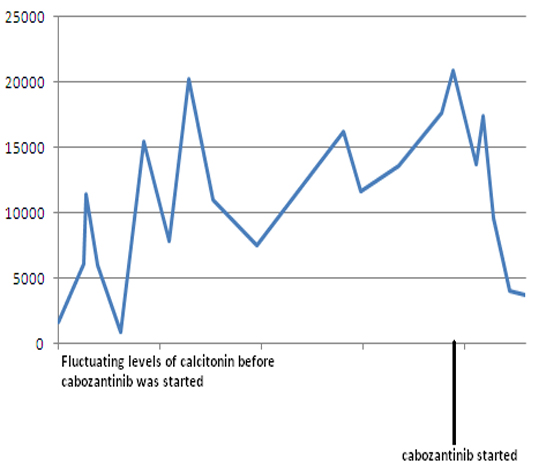
Figure 12. Serum calcitonin levels following cabozantinib therapy. Y-axis: serum calcitonin in pg/mL.