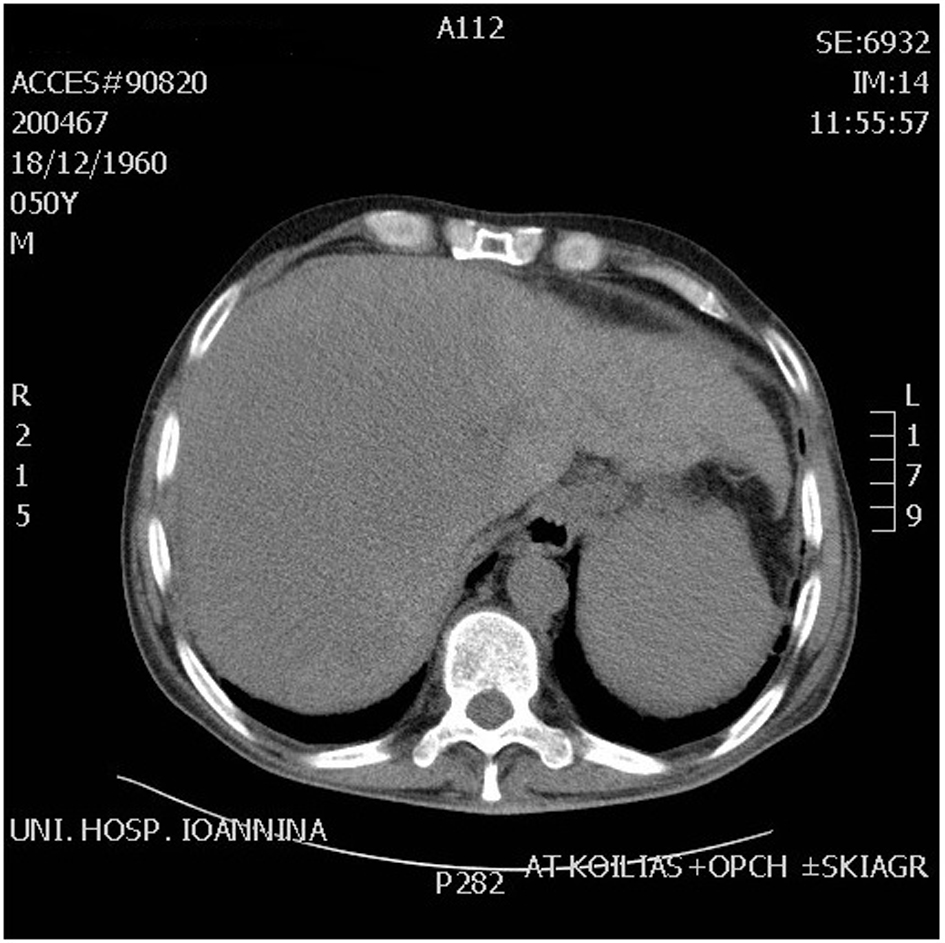
Figure 1. CT scan abdomen showing huge mass in the right lobe of liver.
| World Journal of Oncology, ISSN 1920-4531 print, 1920-454X online, Open Access |
| Article copyright, the authors; Journal compilation copyright, World J Oncol and Elmer Press Inc |
| Journal website http://www.wjon.org |
Case Report
Volume 5, Number 5-6, December 2014, pages 214-219
Relapsing Episodes of Loss of Consciousness in a Patient With Hepatocellular Carcinoma
Figures
Tables
| Tumor | % of total |
|---|---|
| Data extracted from Zapf (1993), Frystyk et al (1998), Marks and Teale (1998), Fukuda et al (2006) and Tsuro et al (2006) [3-7]. | |
| Tumors of mesenchymal origin | 41 |
| Mesothelioma | 8 |
| Hemangiopericytoma | 7 |
| Solitary fibrous tumor | 7 |
| Leiomyosarcoma/gastrointestinal stromal tumor | 6 |
| Fibrosarcoma | 5 |
| Others | 8 |
| Tumors of epithelial origin | 43 |
| Hepatocellular | 16 |
| Stomach | 8 |
| Lung | 4 |
| Colon | 4 |
| Pancreas (non-islet cell) | 3 |
| Prostate | 2 |
| Adrenal | 2 |
| Undifferentiated | 2 |
| Kidney | 1 |
| Others | 1 |
| Tumors of neuroendocrine origin | 1 |
| Tumors of hematopoietic origin | 1 |
| Tumors of unknown origin | 14 |
| Laboratory test | Results | Units | Reference values |
|---|---|---|---|
| WBC | 7.420 | 103/µL | 7.000 - 11.000 |
| HG | 14.40 | g/dL | 12 - 18 |
| Ht | 42.3 | % | 36 - 48 |
| PLT | 222 | 103/µL | 150.000 - 400.000 |
| PT | 13.6 | s | Normal |
| INR | 1.03 | - | 0.8 - 1.2 |
| Glu | 30 | mg/dL | 70 - 125 |
| Ur | 18 | mg/dL | 11 - 54 |
| Cr | 0.6 | mg/dL | 0.6 - 1.2 |
| BILIRUBIL | 0.6 | mg/dL | 0.1 - 1 |
| BILL-DIRECT | 0.16 | mg/dL | 0.01 - 0.2 |
| AST | 91 | IU/L | 10 - 35 |
| ALT | 42 | IU/L | 10 - 35 |
| γGT | 233 | IU/L | 10 - 52 |
| ALP | 97 | IU/L | Adults 30 - 125 IU/L |
| Total protein | 6.7 | g/dL | 6 - 8.4 |
| Albumin | 2.8 | g/dL | 3.4 - 5 |
| LDH | 392 | U/L | 115 - 230 |
| Calcium | 8.8 | mg/dL | 8.2 - 10.6 |
| Sodium | 144 | mEq/L | 135 - 153 |
| Potassium | 3.23 | mEq/L | 3.5 - 5.3 |
| Time (min) | Glucose (NR: 70 - 125 mg/mL) | Insulin (NR: 1.9 - 23 µIU/mL) |
|---|---|---|
| NR: normal ratio. | ||
| 10 before | 30 | 0.6 |
| 0 | 89 | 0.7 |
| 15 | 155 | 1.1 |
| 30 | 146 | 0.6 |
| 45 | 141 | 0.5 |
| Modality | Results | Conclusion |
|---|---|---|
| Serum glucose levels | 30 mg/dL (70 - 125) | Hypoglycemia |
| Clinical manifestations | Hepatomegaly, palmar erythema spider nevi | Hepatic disease |
| Complete blood count | Normal | - |
| Serum chemistry | Normal | Child Pugh A |
| Coagulation test | Normal | Child Pugh A |
| AFP | 7.794 ng/mL (<9 ng/mL) | MCC |
| TSH | 1.56 µIU/mL (0.34 - 5.6) | Normal, exclusion of hypothyroidism |
| Serum cortisol | 26 mg/dL (6.7 - 22.6) | Adequate response, exclusion of adrenocortical insufficiency |
| Insulin | 0.5 µIU/mL (1.9 - 23 µIU/mL) | Suppressed levels during hypoglycemia (excludes insulinoma) |
| Glucagon test | Positive | Paraneoplastic insulin-like secretion |
| IGF-I | 29.4 ng/mL (51 - 297) | Low |
| IGF-II | 485 ng/mL (288 - 736) | Normal |
| IGF-II/IGF-I ratio | > 10:1 | Consistent with non-islet cell tumor hypoglycemia |
| Immunohistological stains of IGF-II | Not defined | - |
| CT scan abdomen | Positive | Large tumor volume |