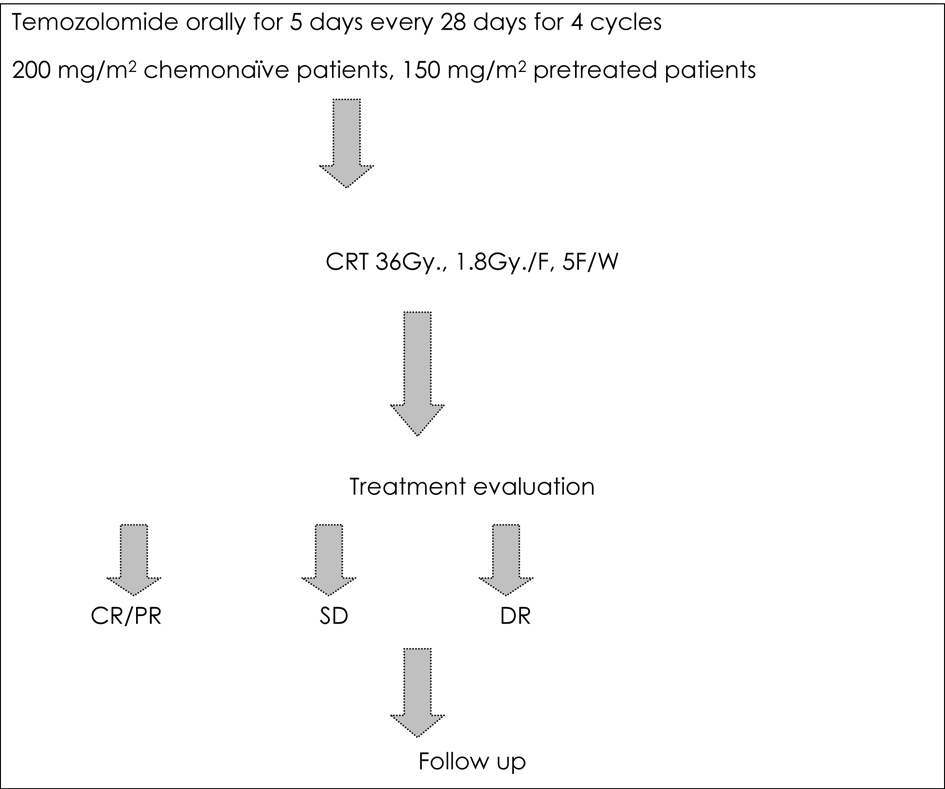
Figure 1. Treatment protocol for the current study.
| World Journal of Oncology, ISSN 1920-4531 print, 1920-454X online, Open Access |
| Article copyright, the authors; Journal compilation copyright, World J Oncol and Elmer Press Inc |
| Journal website http://www.wjon.org |
Original Article
Volume 5, Number 3, June 2014, pages 118-125
Temozolomide and Reirradiation in Recurrent Grade II Brain Glioma
Figures

Tables
| Complete response (CR) | Disappearance of all contrast-enhancing tumor. |
| Partial response (PR) | 50% or more reduction in the size of measurable disease. |
| Disease progression (DP) | 25% or more increase in the size of measurable disease. |
| Stable disease (SD) | All other situations. |
| Hematology | |||
| For day 1 | |||
| Neutrophils (103/mL) | Platelets (103/mL) | Dose | |
| ≥ 1.5 | and | > 100 | 100% |
| < 1.5 | or | < 100 | Delay |
| Renal function test | |||
| Creatinine | Dose | ||
| < 2 upper normal limit | 100% | ||
| ≥ 2 upper normal limit | Delay | ||
| Liver function tests | |||
| Bilirubin (µmol/L) | ALT, AST | Dose | |
| ≤ 25 | and | ≤ 2.5 upper normal limit | 100% |
| > 25 | or | > 2.5 upper normal limit | Delay |
| Characteristics | Details | Patients No. | Percentage (%) |
|---|---|---|---|
| Age | 18 - 20 | 6 | 30 |
| > 20 - 40 | 11 | 55 | |
| > 40 - 60 | 3 | 15 | |
| > 60 | 0 | 0 | |
| Sex | Male | 15 | 75 |
| Female | 5 | 25 | |
| Performance status | 100 | 3 | 6.7 |
| 90 | 9 | 23.3 | |
| 80 | 8 | 43.3 | |
| 70 | 0 | 23.3 | |
| 60 | 0 | 3.3 | |
| Pathology | LGG | 18 | 90 |
| Ependymoma | 2 | 10 | |
| Site of recurrence | Temporal lobe | 13 | 65 |
| Parietal lobe | 6 | 30 | |
| Cerebellar | 1 | 5 | |
| Pretreatment tumor size | 1 - 2 cm | 9 | 45 |
| 2 - 4 cm | 11 | 55 | |
| > 5 cm | 0 | 0 |
| Patient number | Response achieved | Age | Sex | PS | Pathology type | Time interval |
|---|---|---|---|---|---|---|
| 1 | CR | 27 | male | 100 | LGG | 15 |
| 2 | CR | 20 | male | 90 | LGG | 17 |
| 3 | PR | 18 | female | 90 | LGG | 12 |
| 4 | PR | 18 | male | 100 | LGG | 15 |
| 5 | PR | 18 | male | 90 | Ependymoma | 13 |
| 6 | PR | 31 | male | 90 | LGG | 16 |
| 7 | PR | 19 | female | 100 | LGG | 17 |
| 8 | PR | 32 | male | 90 | LGG | 12 |
| 12-month OS | Number (%) | P value |
|---|---|---|
| Age | ||
| < 40 years old | 16 (94%) | 0.001 |
| > 40 years old | 1 (33%) | 0.001 |
| Performance status | ||
| 100-90 | 11 (91%) | 0.6 |
| 80 | 6 (75%) | 0.6 |
| Tumor size | ||
| < 2 cm | 8 (89%) | 0.03 |
| > 2 cm | 9 (81%) | 0.03 |
| Time interval between the two RT courses | ||
| 8 - 12 months | 5 (71%) | 0.001 |
| 12 - 16 months | 11 (91%) | 0.001 |
| 16 - 18 months | 1 (100%) | 0.001 |