World Journal of Oncology, ISSN 1920-4531 print, 1920-454X online, Open Access
Article copyright, the authors; Journal compilation copyright, World J Oncol and Elmer Press Inc
Journal website http://www.wjon.org

Original Article

Volume 5, Number 4, August 2014, pages 155-165


Significance of Fractionated Administration of Thalidomide Combined With γ-Ray Irradiation in Terms of Local Tumor Response and Lung Metastasis

Figures

Figure 1.
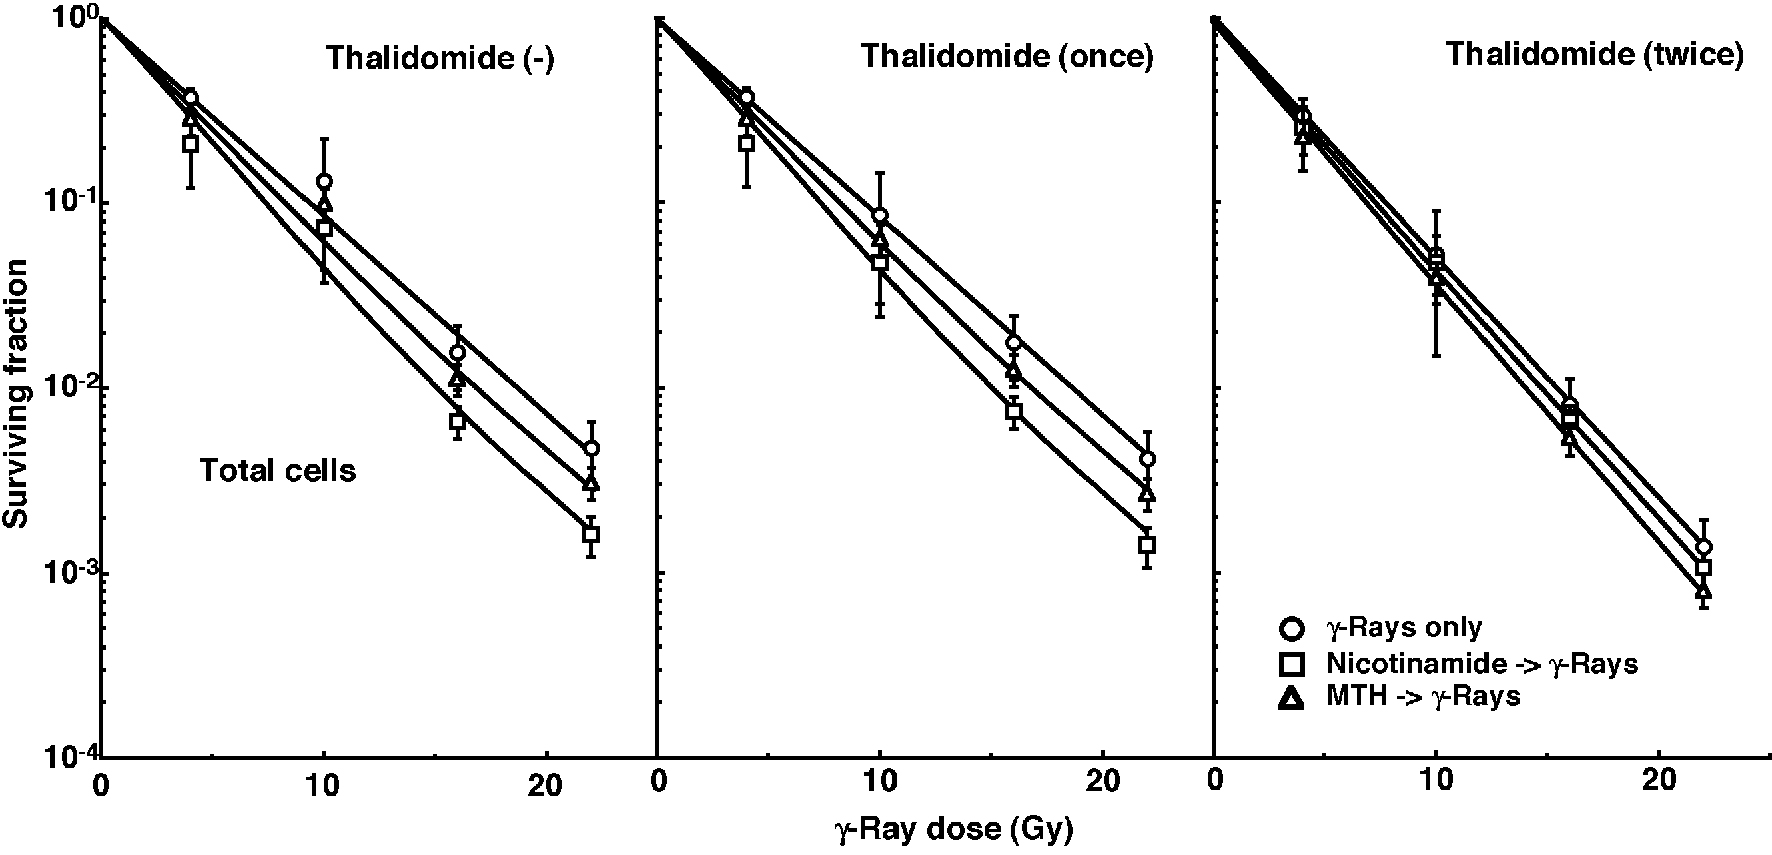
Figure 1. Cell survival curves for the total cell population from B16-BL6 tumors irradiated with γ-rays following single or two intraperitoneal administrations of thalidomide in combination with nicotinamide treatment or mild temperature hyperthermia (MTH) on day 18 after tumor cell inoculation. Circles: γ-ray irradiation only; squares: γ-ray irradiation with nicotinamide treatment; triangles: γ-ray irradiation with MTH. Bars represent standard errors (n = 6).
Figure 2.
Figure 2. Dose response curves of the net micronucleus frequency for total (open symbols: left panels) and quiescent (solid symbols: right panels) cell populations from B16-BL6 tumors irradiated with γ-rays following single or two intraperitoneal administrations of thalidomide in combination with nicotinamide treatment or mild temperature hyperthermia (MTH) on day 18 after tumor cell inoculation. Circles: γ-ray irradiation only; squares: γ-ray irradiation with nicotinamide treatment; triangles: γ-ray irradiation with MTH. Bars represent standard errors (n = 6).
Figure 3.
Figure 3. Counted numbers of macroscopic metastases in the lung on day 35 after tumor cell inoculation as a function of the dose of γ-ray irradiation following the single or two intraperitoneal administrations of thalidomide in combination with nicotinamide treatment or mild temperature hyperthermia (MTH) on day 18 after tumor cell inoculation. Circles: γ-ray irradiation only; squares: γ-ray irradiation with nicotinamide treatment; triangles: γ-ray irradiation with MTH. Bars represent standard errors (n = 6).

Tables

Table 1. Surviving Fraction and Micronucleus Frequency at 0 Gy
 
Without thalidomideWith thalidomide (once)With thalidomide (twice)
aMean ± standard error (n = 6). Q cells showed significantly higher micronucleus frequencies than the total cell population under each set of conditions (P < 0.05). Thalidomide administration resulted in significantly lower surviving fractions and significantly higher micronucleus frequencies in both the total and Q cell populations than absolutely no treatment (P < 0.05).
Surviving fraction at 0 Gy (%)
  Without nicotinamide or mild temperature hyperthermia84.4 ± 8.2a60.0 ± 5.569.8 ± 6.3
  With nicotinamide81.4 ± 7.355.0 ± 4.360.0 ± 5.7
  With mild temperature hyperthermia83.5 ± 8.756.0 ± 5.960.5 ± 5.3
Micronucleus frequency at 0 Gy
  Total tumor cell population
  Without nicotinamide or mild temperature hyperthermia0.050 ± 0.0050.081 ± 0.0080.070 ± 0.007
  With nicotinamide0.057 ± 0.0060.090 ± 0.0080.082 ± 0.008
  With mild temperature hyperthermia0.054 ± 0.0050.085 ± 0.0090.080 ± 0.008
Quiescent cells
  Without nicotinamide or mild temperature hyperthermia0.077 ± 0.0070.102 ± 0.010.094 ± 0.009
  With nicotinamide0.084 ± 0.0080.11 ± 0.010.101 ± 0.01
  With mild temperature hyperthermia0.081 ± 0.0080.103 ± 0.010.099 ± 0.009


Table 2. Enhancement Ratiosa Due to Combined Treatment With Thalidomide
 
With thalidomide (once)With thalidomide (twice)
aThe ratio of the dose of radiation necessary to obtain each end-point without thalidomide to that needed to obtain each end-point with thalidomide. b Mean ± standard error (n = 6). c, dSignificant differences between two values (P < 0.05).
Surviving fraction = 0.03
  Total cell population1.0 ± 0.05b, c1.25 ± 0.1c
Net micronucleus frequency = 0.6
  Total cell population1.0 ± 0.05d1.2 ± 0.1d
  Quiescent cells1.05 ± 0.11.1 ± 0.1


Table 3. Enhancement Ratiosa Due to Combined Treatment With Nicotinamide, or Mild Temperature Hyperthermia
 
NicotinamideMild temperature hyperthermia
aThe ratio of the dose of radiation necessary to obtain each end-point without nicotinamide or mild temperature hyperthermia to that needed to obtain each end-point with nicotinamide or mild temperature hyperthermia. bMean ± standard error (n = 6).
Surviving fraction = 0.03
  Total cell population
    Without thalidomide1.25 ± 0.1b1.15 ± 0.05
    With thalidomide (once)1.25 ± 0.11.15 ± 0.05
    With thalidomide (twice)1.05 ± 0.051.1 ± 0.05
Net micronucleus frequency = 0.6
  Total cell population
    Without thalidomide1.2 ± 0.11.05 ± 0.05
    With thalidomide (once)1.3 ± 0.11.05 ± 0.05
    With thalidomide (twice)1.05 ± 0.051.1 ± 0.05
  Quiescent cells
    Without thalidomide1.1 ± 0.051.2 ± 0.1
    With thalidomide (once)1.05 ± 0.051.15 ± 0.05
    With thalidomide (twice)1.1 ± 0.051.2 ± 0.05


Table 4. Dose-Modifying Factors for Quiescent Cells Relative to the Total Tumor Cell Populationa
 
Without thalidomideWith thalidomide (once)With thalidomide (twice)
aThe ratio of the dose of radiation necessary to obtain each end-point in the quiescent cell population to that needed to obtain each end-point in the total tumor cell population. bMean ± standard error (n = 6).
Net micronucleus frequency = 0.6
  γ-Rays only1.65 ± 0.15b1.6 ± 0.11.9 ± 0.15
  With nicotinamide1.8 ± 0.152.0 ± 0.151.8 ± 0.15
  With mild temperature hyperthermia1.6 ± 0.151.55 ± 0.11.7 ± 0.1


Table 5. The Numbers of Metastases From the Irradiated Tumors That Received Cytotoxic Treatment Producing a Similar Initial Local Effecta
 
Without thalidomideWith thalidomide (once)With thalidomide (twice)
aBased on the data shown in Fig. 4, the estimated numbers of lung metastatic nodules from local tumors that received neutron beam irradiation with or without thalidomide in combination with nicotinamide or mild temperature hyperthermia, which produced an identical surviving fraction of 0.6 as an initial effect on Fig. 1. bMean ± standard error (n = 6). c-hSignificant differences between two values (P < 0.05).
Surviving fraction = 0.03
  γ-Rays only14.1 ± 1.4b, c, d, e12.2 ± 1.311.9 ± 1.2
  With nicotinamide13.1 ± 1.311.4 ± 1.2c, f11.3 ± 1.2d, g
  With mild temperature hyperthermia14.1 ± 1.4f, g, h12.2 ± 1.210.6 ± 1.1e, h