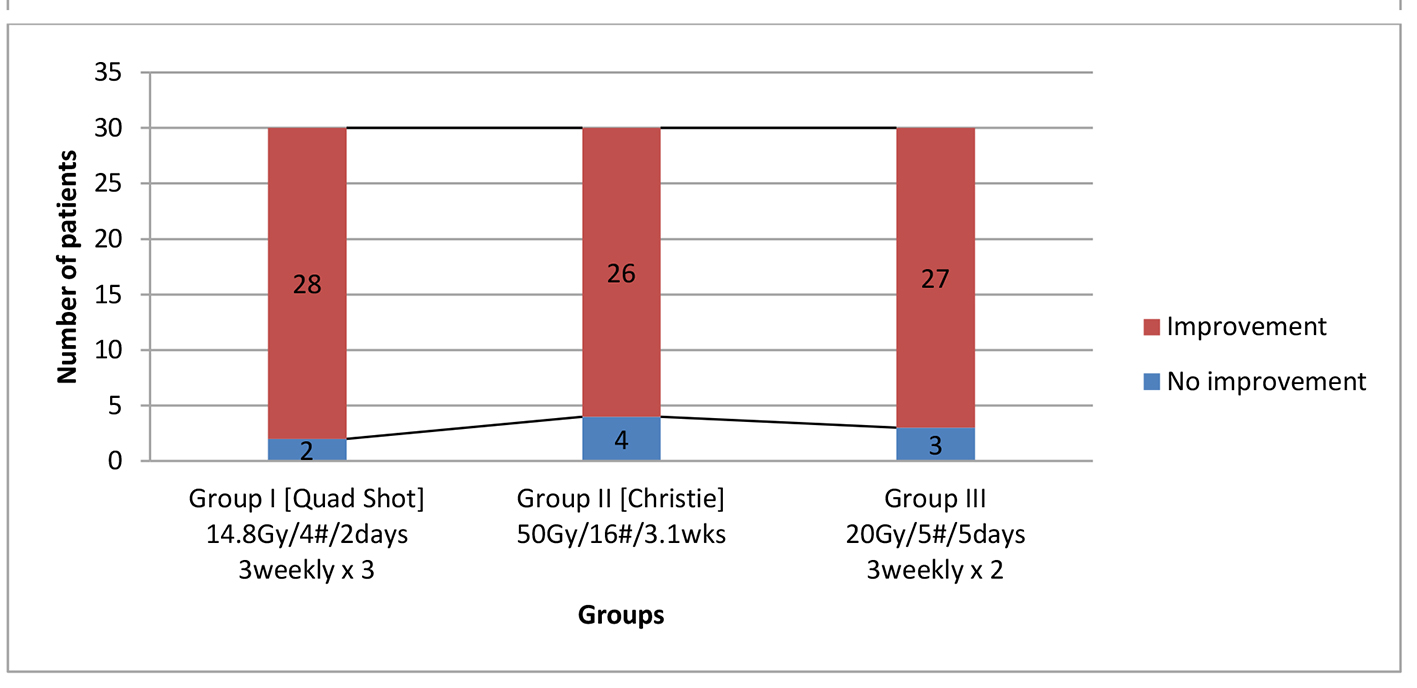
Figure 1. Locally advanced head and neck cancer comparison of three palliative radiotherapy schedules on overall quality of life (n = 90). P values for group I = 0.4, group II = 0.7, group III = 0.6 (not significant).
| World Journal of Oncology, ISSN 1920-4531 print, 1920-454X online, Open Access |
| Article copyright, the authors; Journal compilation copyright, World J Oncol and Elmer Press Inc |
| Journal website http://www.wjon.org |
Original Article
Volume 8, Number 1, February 2017, pages 7-14
Comparative Evaluation of Three Palliative Radiotherapy Schedules in Locally Advanced Head and Neck Cancer
Figures
Tables
| Group I (Quad Shot) | Group II (Christie) | Group III (conventional) | |
|---|---|---|---|
| Age, years | |||
| Range | 35 - 85 | 28 - 77 | 30 - 72 |
| Median | 56 | 51 | 56 |
| Gender, n (%) | |||
| M | 26 (86.7%) | 27 (90.0%) | 24 (80.0%) |
| F | 4 (13.3%) | 3 (10.0%) | 6 (20.0%) |
| Native place, n (%) | |||
| Rural | 22 (73.3%) | 24 (80.0%) | 25 (83.3%) |
| Urban | 8 (26.7%) | 6 (20.0%) | 5 (16.7%) |
| KPS, n (%) | |||
| 80 | 27 (90.0%) | 28 (93.3%) | 28 (93.3%) |
| 90 | 3 (10.0%) | 2 (6.7%) | 2 (6.7%) |
| Site, n (%) | |||
| Base of tongue | 10 (33.3%) | 11 (36.6%) | 9 (30.0%) |
| Tonsil | 7 (23.3%) | 8 (26.7%) | 4 (13.3%) |
| Hypopharynx | 3 (10.0%) | 5 (16.7%) | 2 (6.7%) |
| Larynx | 2 (6.7%) | 3 (10.0%) | 8 (22.7%) |
| Vallecula | 2 (6.7%) | 0 (0.0%) | 2 (6.7%) |
| Soft palate/ uvula | 2 (6.7%) | 0 (0.0%) | 1 (3.3%) |
| Buccal mucosa | 0 (0.0%) | 0 (0.0%) | 1 (3.3%) |
| Retromolar trigone | 1 (3.3%) | 0 (0.0%) | 1 (3.3%) |
| Floor of mouth | 0 (0.0%) | 1 (3.3%) | 2 (6.7%) |
| Anterior tongue | 3 (10.0%) | 2 (6.7%) | 0 (0.0%) |
| Smoking, n (%) | |||
| Yes | 24 (80.0%) | 25 (83.3%) | 23 (76.7%) |
| No | 6 (20.0%) | 5 (16.7%) | 7 (23.3%) |
| Tobacco chewing, n (%) | |||
| Yes | 12 (40.0%) | 13 (43.3%) | 11 (36.7%) |
| No | 18 (60.0%) | 17 (56.7%) | 19 (63.3%) |
| Histopathological distribution, n (%) | |||
| WDSCC | 1 (3.3%) | 6 (20.0%) | 2 (6.7%) |
| MDSCC | 23 (76.7%) | 21 (70.0%) | 23 (76.7%) |
| PDSCC | 2 (6.7%) | 1 (3.3%) | 2 (6.7%) |
| SCC(NOS) | 4 (13.3%) | 2 (6.7%) | 3 (10.0%) |
| Stage, n (%) | |||
| III | 4 (13.3%) | 3 (10.0%) | 3 (10.0%) |
| IV | 26 (86.7%) | 27 (90.0%) | 27 (90.0%) |
| Sr. No. | Symptom | Group I (Quad Shot) | Group II (Christie) | Group III (conventional) | ||||||
|---|---|---|---|---|---|---|---|---|---|---|
| Mean ± standard deviation | P value | Mean ± standard deviation | P value | Mean ± standard deviation | P value | |||||
| Pre-RT | Post-RT | Pre-RT | Post-RT | Pre-RT | Post-RT | |||||
| Mean ± standard deviation score for each domain using Wilcoxan signed rank test. *Statistically significant. | ||||||||||
| 1 | Pain | 50 ± 15.54 | 100 ± 26.59 | 0.001* | 50 ± 9.48 | 75 ± 29.16 | 0.002* | 50 ± 13.02 | 75 ± 26.21 | 0.001* |
| 2 | Appearance | 50 ± 13.02 | 75 ± 16.08 | 0.000* | 50 ± 8.64 | 75 ± 17.47 | 0.000* | 50 ± 11.37 | 75 ± 15.99 | 0.000* |
| 3 | Activity | 50 ± 18.49 | 100 ± 22.36 | 0.000* | 50 ± 13.27 | 75 ± 13.90 | 0.000* | 50 ± 13.13 | 75 ± 19.35 | 0.000* |
| 4 | Recreation | 50 ± 12.60 | 75 ± 16.61 | 0.000* | 50 ± 11.53 | 75 ± 14.58 | 0.000* | 50 ± 8.64 | 75 ± 16.54 | 0.000* |
| 5 | Swallowing | 33 ± 28.07 | 67 ± 27.58 | 0.076 | 33 ± 18.08 | 67 ± 30.12 | 0.007* | 33 ± 22.70 | 67 ± 27.45 | 0.021* |
| 6 | Chewing | 100 ± 28.57 | 75 ± 25.43 | 0.763 | 50 ± 24.51 | 50 ± 24.91 | 0.782 | 100 ± 28.57 | 75 ± 25.43 | 0.782 |
| 7 | Speech | 83.5 ± 26.75 | 100 ± 25.55 | 0.968 | 67 ± 16.17 | 67 ± 18.67 | 0.705 | 100 ± 28.30 | 100 ± 22.62 | 0.713 |
| 8 | Shoulder | 100 ± 23.1 | 100 ± 16.99 | 0.414 | 100 ± 12.23 | 100 ± 12.23 | 1 | 100 ± 23.51 | 100 ± 17.00 | 0.366 |
| 9 | Taste | 100 ± 26.55 | 67 ± 17.50 | 0.009* | 100 ± 0.00 | 67 ± 22.32 | 0.000* | 100 ± 21.62 | 67 ± 24.72 | 0.001* |
| 10 | Saliva | 100 ± 0.00 | 67 ± 17.10 | 0.000* | 100 ± 0.00 | 67 ± 13.83 | 0.000* | 100 ± 0.00 | 67 ± 10.76 | 0.000* |
| 11 | Mood | 25 ± 23.81 | 75 ± 31.03 | 0.001* | 25 ± 18.28 | 75 ± 29.65 | 0.010* | 25 ± 21.51 | 75 ± 27.61 | 0.001* |
| 12 | Anxiety | 33 ± 21.11 | 67 ± 25.39 | 0.005* | 33 ± 19.05 | 67 ± 23.92 | 0.216 | 33 ± 20.95 | 67 ± 22.21 | 0.022* |
| 13 | Physical domain score | 50 ± 13.22 | 67 ± 14.63 | 0.043* | 50 ± 8.83 | 61.33 ± 13.63 | 0.06 | 50 ± 13.91 | 67 ± 12.52 | 0.002* |
| 14 | Social domain score | 25 ± 10.17 | 75 ± 31.95 | 0.000* | 25 ± 0.00 | 62.5 ± 23.38 | 0.000* | 25 ± 8.64 | 75 ± 7.45 | 0.000* |
| 15 | HRQOL 7 days | 20 ± 10.51 | 60 ± 22.38 | 0.000* | 20 ± 3.65 | 40 ± 24.16 | 0.000* | 20 ± 7.43 | 60 ± 20.44 | 0.000* |
| 16 | Overall QOL | 20 ± 10.51 | 60 ± 23.77 | 0.000* | 20 ± 3.65 | 40 ± 24.16 | 0.000* | 20 ± 7.43 | 60 ± 21.87 | 0.000* |
| Group | Stage | NED | Primary site failure | Nodal failure | Both primary and nodal failure |
|---|---|---|---|---|---|
| Group I Quad shot | III | 0/4 (0.00%) | 3/4 (75.00%) | 2/4 (50.00%) | 1/4 (25.00%) |
| IV | 6/26 (23.07%) | 17/26 (65.38%) | 16/26 (61.54%) | 13/26 (50.00%) | |
| Total | 6/30 (2.00%) | 20/30 (66.67%) | 18/30 (60.00%) | 14/30 (46.67%) | |
| Group II Christie | III | 2/3 (66.67%) | 1/3 (33.33%) | 0/3 (0.00%) | 0/3 (0.00%) |
| IV | 6/27 (22.22%) | 20/27 (74.07%) | 18/27 (66.67%) | 17/27 (62.96%) | |
| Total | 8/30 (26.67%) | 21/30 (70.00%) | 18/30 (60.00%) | 17/30 (56.67%) | |
| Group III conventional | III | 0/3 (0.00%) | 3/3 (100.00%) | 2/3 (66.67%) | 2/3 (66.67%) |
| IV | 4/27 (14.81%) | 21/27 (77.77%) | 15/27 (55.55%) | 14/27 (51.85%) | |
| Total | 4/30 (13.33%) | 24/30 (80.00%) | 17/30 (56.67%) | 16/30 (53.33%) | |
| All groups | 18/90 (20.0%) | 65/90 (72.22%) | 53/90 (58.89%) | 47/90 (52.22%) | |