

| World Journal of Oncology, ISSN 1920-4531 print, 1920-454X online, Open Access |
| Article copyright, the authors; Journal compilation copyright, World J Oncol and Elmer Press Inc |
| Journal website https://www.wjon.org |
Original Article
Volume 12, Number 5, October 2021, pages 165-172

Maximum Plasma Concentration of Lenvatinib Is Useful for Predicting Thrombocytopenia in Patients Treated for Hepatocellular Carcinoma
Mizuki Endoa, Koichi Hondaa, c, Tomoko Saitoa, Ken Shiraiwab, Yoshio Sueshigeb, Tomoko Tokumarua, Masao Iwaoa, Masanori Tokoroa, Mie Arakawaa, Ryota Tanakab, Ryosuke Tatsutab, Masataka Seikea, Hiroki Itohb, Kazunari Murakamia
aDepartment of Gastroenterology, Faculty of Medicine, Oita University, 1-1 Idaigaoka, Hasama-machi, Yufu-City, Oita 879-5593, Japan
bDepartment of Clinical Pharmacy, Oita University Hospital, 1-1 Idaigaoka, Hasama-machi, Yufu-City, Oita 879-5593, Japan
cCorresponding Author: Koichi Honda, Department of Gastroenterology, Faculty of Medicine, Oita University, 1-1 Idaigaoka, Hasama-machi, Yufu-City, Oita 879-5593, Japan
Manuscript submitted July 13, 2021, accepted September 10, 2021, published online October 5, 2021
Short title: Cmax of Lenvatinib Can Predict Thrombocytopenia
doi: https://doi.org/10.14740/wjon1399
| Abstract | ▴Top |
Background: Although lenvatinib treatment has a favorable efficacy for unresectable hepatocellular carcinoma (HCC), it is associated with adverse events (AEs) that must be closely monitored and managed. Thrombocytopenia is one of the major AEs. The aim of this study was to clarify whether thrombocytopenia can be predicted by the plasma concentration of lenvatinib.
Methods: This was a single-center retrospective observational study. Twenty-three patients with unresectable HCC and pharmacokinetics data at the initial lenvatinib administration between May 2018 and September 2020 at Oita University Hospital were enrolled. The AEs during the 4 weeks after the initiation of treatment were evaluated, and the correlations between the thrombocytopenia and the plasma concentration of lenvatinib were examined. Spearman’s correlation was used to evaluate the correlation between two continuous variables.
Results: The rate of platelet count decrease correlated with the maximum plasma concentration (Cmax) (r = 0.65, P = 0.001), whereas it did not with the minimum plasma concentration (Cmin) (r = 0.29, P = 0.206). After stepwise multiple linear regression analysis, the starting dose of lenvatinib and the serum albumin concentration were identified as independent explanatory variables. Next, a formula for predicting the Cmax using these two variables was created. The predicted Cmax was strongly correlated with the Cmax (r = 0.87, P < 0.0001) and the rate of platelet count decrease (r = 0.67, P = 0.001).
Conclusions: This study identified the usefulness of the drug Cmax to predict the rate of platelet count decrease within 4 weeks after the initiation of treatment. Although it is difficult to measure the plasma concentration of lenvatinib in community hospitals, the predicted Cmax is useful for predicting the rate of platelet count decrease with this treatment.
Keywords: Hepatocellular carcinoma; Lenvatinib; Plasma concentration; Thrombocytopenia
| Introduction | ▴Top |
Hepatocellular carcinoma (HCC) is one of the most frequently occurring cancers worldwide [1]. If HCC is detected at an early stage and radical treatment is given, the prognosis is not poor [2]. However, HCCs often develop into advanced-stage tumors due to the peculiar features of HCC such as multicentric occurrence and intrahepatic metastasis [3, 4], even if repeated radical treatments are performed. Moreover, hepatitis virus-unrelated (non-B non-C) HCC, which is currently increasing in Japan [5], is often found at the advanced stage [6]. Although transcatheter arterial chemoembolization (TACE) has been widely performed for unresectable HCC [7], repeated TACE results in deterioration of hepatic function, which prevents the introduction of a molecular-targeted drug [8]. Sorafenib has been established as a standard therapy for unresectable advanced HCC since 2007, and it prolonged the overall survival of patients by about 3 months compared to a placebo in the SHARP study [9]. Recently, lenvatinib has become popular as a systemic chemotherapeutic drug for HCC [10]. This drug is a multitargeted tyrosine kinase inhibitor of the vascular endothelial growth factor receptor (VEGFR) family, fibroblast growth factor receptor family, platelet-derived growth factor receptor-alpha, rearranged during transfection, and KIT [11, 12]. The phase 3 REFLECT trial demonstrated that patients treated with lenvatinib had a similar overall survival as those treated with sorafenib, but the progression-free survival, time to progression, and overall response rate of those treated with lenvatinib were significantly greater than those treated by sorafenib [10]. Lenvatinib is a drug that was developed as a treatment for thyroid cancer at a daily dose of 24 mg [13]. Because many patients with HCC have impaired liver function, phase 1 and phase 2 studies for lenvatinib in HCC patients were conducted at a daily dose of 12 mg [14, 15]. A population pharmacokinetic and exposure-response analysis has revealed associations between early drug withdrawal or dose reduction and the area under the curve of the lenvatinib plasma concentration as well as body weight [16]. Based on these findings, a phase 3 study was conducted showing that the optimal dose is 8 mg for a body weight of less than 60 kg and 12 mg for a body weight of 60 kg or more [10]. In this setting, if adverse events (AEs) can be predicted by the lenvatinib plasma concentration, the risk of AEs due to lenvatinib therapy can be reduced in advance, thus avoiding withdrawal of treatment and allowing long-term continuation of treatment. Therefore, the purpose of this study was to clarify whether thrombocytopenia, which is a major AE in HCC patients treated with lenvatinib, can be predicted by measuring the lenvatinib plasma concentration.
| Materials and Methods | ▴Top |
Patients
This was a single-center retrospective observational study that was conducted with the approval of the Ethics Board of our hospital (approval number: 1476 for lenvatinib pharmacokinetics analysis, 1655 for the observational study) and was performed in accordance with the Declaration of Helsinki. A total of 30 consecutive patients starting lenvatinib (Eisai Co., Ltd, Tokyo, Japan) treatment for HCC between May 2018 and September 2020 at our hospital were enrolled in this study. The inclusion criteria for this study were as follows: patients with intermediate-stage or advanced-stage HCC according to the Barcelona Clinic Liver Cancer staging classification [17], patients with HCC that was not applicable to surgical resection or radiofrequency ablation therapy, patients with HCC that was not eligible for TACE or was refractory to TACE, and patients with Child-Pugh (CP) class A or B. All 30 patients matched these criteria. Pharmacokinetics analysis at the time of the initial administration of lenvatinib was started with the fifth patient among the 30 consecutive patients. Overall, three patients refused to have pharmacokinetics analysis performed. Finally, a total of 23 patients whose drug plasma concentration was measured were included in this study.
Blood sampling
The patients weighing < 60 kg received lenvatinib orally at an initial dose of 8 mg/day, while the patients weighing ≥ 60 kg received lenvatinib orally at an initial dose of 12 mg/day; however, if the attending physician decided that a dose reduction was necessary considering the patient’s conditions such as age or liver function, the initial dose was reduced. After starting lenvatinib treatment, the attending physician could also modify the dose considering the patient’s condition. Pharmacokinetics analysis was performed at the first drug administration, and the blood was sampled before taking lenvatinib as well as 1, 2, 4, 8, and 24 h after taking the drug. After the measurements of five patients were completed, the protocol was changed. Another 18 patients were analyzed by the following modified pharmacokinetics protocol: blood was sampled before taking lenvatinib as well as 2, 4, 6, 8, 12, and 24 h after taking the drug. The maximum plasma concentration observed (Cmax), the minimum plasma concentration observed (Cmin), that is, the plasma concentration after 24 h, and the time that the maximum plasma concentration (Tmax) was reached were determined by the pharmacokinetics analysis. Blood samples were collected from the patient’s brachial vein into a blood collection tube containing EDTA-2Na and were immediately centrifuged at 3,500 rpm and 25 °C for 5 min. Plasma samples were stored frozen at -40 °C until use. Quantification of lenvatinib was performed using ultra-performance liquid chromatography coupled to tandem mass spectrometry (UPLC-MS/MS) [18].
Measurement of lenvatinib using UPLC-MS/MS
The plasma concentration of lenvatinib was measured using UPLC-MS/MS [18]. Calibration, quality control (QC), and internal standard (IS) solutions were prepared by diluting the stock solution in 100% methanol. Deuterated lenvatinib (lenvatinib-d4) was used as an IS. For sample pretreatment, solid-phase extraction with an OASIS® MCX µElution plate was used. For the calibration or QC sample, 330 µL of 4% aqueous phosphoric acid solution, 20 µL of IS (100 ng/mL), 100 µL of calibration or QC solution, and 100 µL of blank plasma were added to a 2-mL polypropylene tube and vortexed for 20 s. The patient plasma sample (100 µL) was mixed with 330 µL of 4% aqueous phosphoric acid solution, 20 µL of IS (100 ng/mL), and 100 µL of 100% methanol for volume adjustment. The MCX µElution plate was conditioned and equilibrated by adding 200 µL of 100% methanol and 200 µL of ultrapure water to each well. Then, 500 µL of the above mixture containing calibration, QC, or patient sample was added to each well. Each well was washed with 200 µL of 2% aqueous formic acid solution followed by 200 µL of 100% methanol. After the washing step, the analyte was eluted with 100 µL of 1.25% ammonium solution (25% aqueous ammonia/100% methanol = 5/95) into a round-well collection plate (Waters). Subsequently, 100 µL of ultrapure water was added to each well, and the contents were mixed by pipetting. The plate was sealed with an adhesive seal (Waters). The injection volume was 10 µL. Lenvatinib was separated using an ACQUITY UPLC® BEH C18 column. The MS/MS transitions monitored in the positive ionization mode for lenvatinib and lenvatinib-d4 were m/z 427.02 → m/z 370.05 and m/z 431.09 → m/z 370.05, respectively. The mobile phase was a gradient of 0.1% aqueous formic acid solution:0.1% formic acid/acetonitrile solution. Validation was performed according to the US Food and Drug Administration guidelines.
Correlation between platelet count decrease and lenvatinib plasma concentration
The AEs during the 4 weeks (28 days) after the initiation of lenvatinib treatment were evaluated by Common Terminology Criteria for AEs (CTCAE), version 5.0. In addition, the number of patients with interruption or dose reduction of lenvatinib as well as the causes of interruption or reduction was evaluated. The total lenvatinib dose for 4 weeks was assessed, excluding the patients who discontinued treatment. Since a platelet count decrease is an important AE that is often experienced by patients with HCC who are treated with lenvatinib, the rate of platelet count decrease ((pretreatment value - minimum value for 4 weeks)/pretreatment value × 100 (%)) was calculated. The correlations between the rate of platelet count decrease and the lenvatinib plasma concentration, baseline characteristics of the patients, and the total lenvatinib dose for 4 weeks were analyzed; two patients who discontinued treatment (one patient discontinued treatment at day 4 and one patient discontinued treatment at day 5) were excluded from this analysis.
Furthermore, since it is difficult to measure the lenvatinib plasma concentration in community hospitals, a formula for predicting the Cmax was created. The prediction formula was created using data from all patients (n = 23), including the two patients who discontinued treatment.
Statistical analysis
Continuous data were shown as the median and range or mean ± standard deviation. Independent continuous data were compared using the unpaired t-test. Spearman’s correlation was used to evaluate the correlation between two continuous variables. Stepwise multiple linear regression analysis was performed to create a formula for predicting the Cmax. A P-value less than 0.05 was considered statistically significant. All statistical analyses were performed using the software IBM SPSS Statistics version 22.0 for Windows.
| Results | ▴Top |
Baseline data and AEs within 4 weeks of treatment initiation
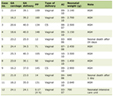
The baseline characteristics of the 23 patients included in this study before treatment with lenvatinib are summarized in Table 1. The AEs within 4 weeks of treatment initiation of any grade are listed in Table 2. A platelet count decrease was the most frequently found AE, with worsened CTCAE grade observed in 52.2% (12/23) of the patients (Fig. 1). Among the 23 patients, two patients discontinued the treatment, including one patient who discontinued treatment at day 4 due to hemobilia and one patient who discontinued treatment at day 5 due to an increase in the creatinine level. A dose reduction was needed in 10 patients due to a platelet count decrease (n = 5), anorexia plus malaise (n = 2), anorexia plus encephalopathy (n = 1), colitis (n = 1), or a suspected urinary tract infection (n = 1). Drug interruption was required for two patients due to anorexia plus hepatic encephalopathy (n = 1) or anorexia (n = 1). Although four patients had a dose increase (4 - 8 mg for two patients and 8 - 12 mg for two patients), three of these patients returned to the starting dose due to AEs.
 Click to view | Table 1. Baseline Characteristics of Patients (n = 23) |
Click to view | Table 2. Adverse Events Within 4 Weeks of Lenvatinib Initiation in All Patients (n = 23) |
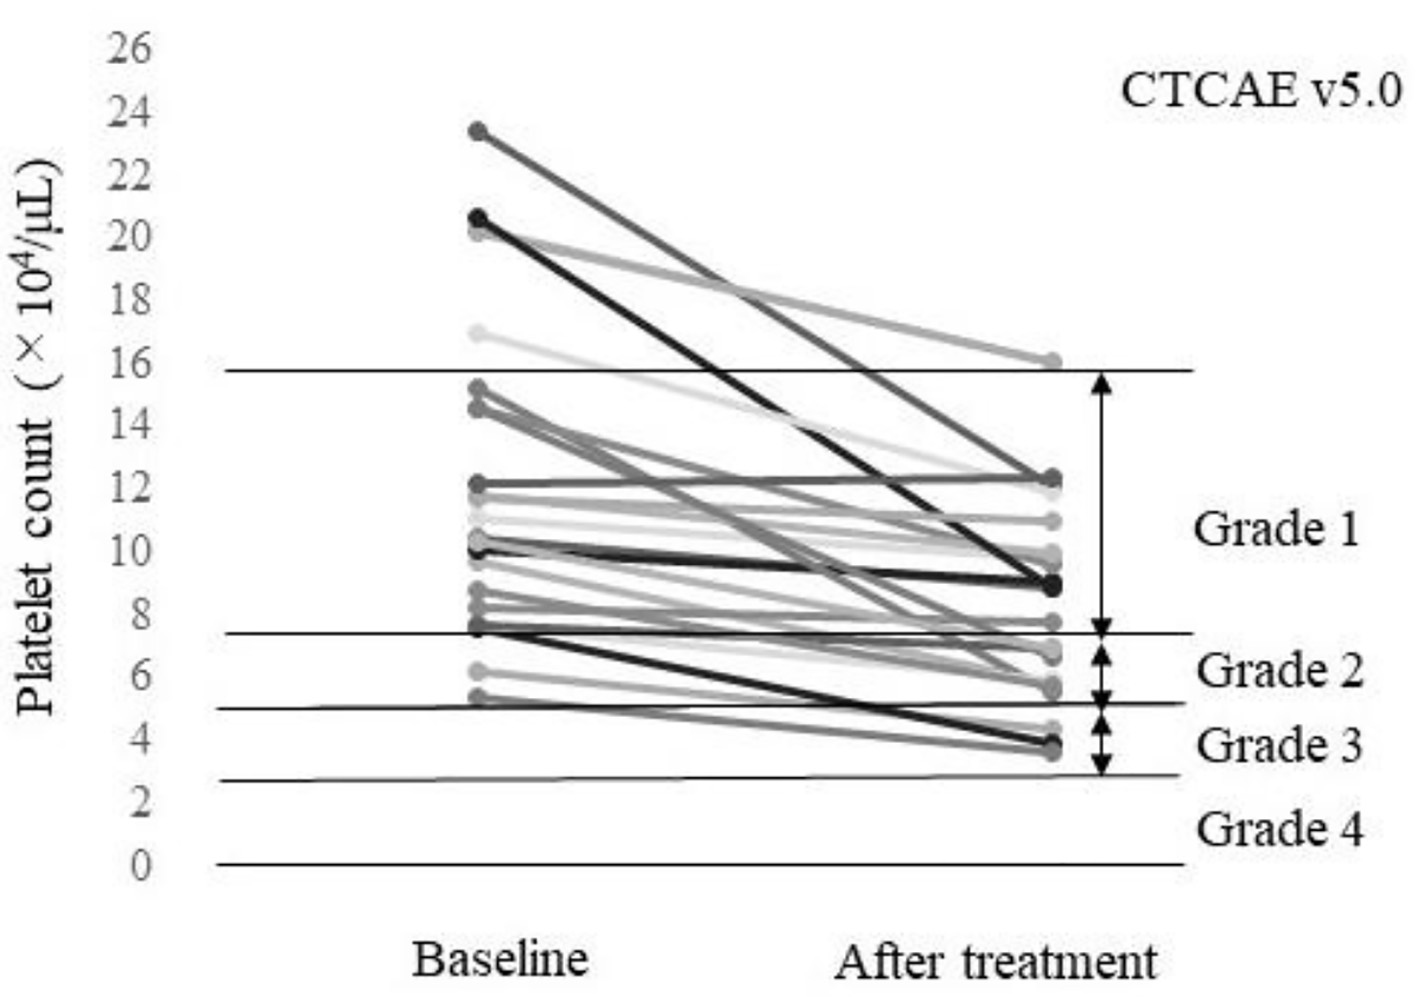 Click for large image | Figure 1. Platelet count of each patient at baseline and after treatment (n = 23). A total of 52.2% (12/23) of the patients had a worsened platelet count grade according to the Common Terminology Criteria for AEs v5.0 (CTCAE v5.0). |
Lenvatinib pharmacokinetics
For the patients with a starting dose of 4 mg (n = 10), the mean Cmax was 43.7 ± 21.3 ng/mL, the mean Cmin was 11.4 ± 3.9 ng/mL, and the Tmax values were 4 h for six patients, 6 h for one patient, 8 h for two patients, and 12 h for one patient. For the patients with a starting dose of 8 mg (n = 8), the mean Cmax was 68.3 ± 18.1 ng/mL, the mean Cmin was 18.5 ± 4.8 ng/mL, and the Tmax values were 4 h for one patient, 6 h for one patient, and 8 h for six patients. For the patients with a starting dose of 12 mg (n = 5), the mean Cmax was 134.2 ± 24.9 ng/mL, the mean Cmin was 21.6 ± 6.9 ng/mL, and the Tmax values were 4 h for three patients, 6 h for one patient, and 8 h for one patient.
Correlation between rate of platelet count decrease and lenvatinib plasma concentration
Figure 2 shows the correlations between the rate of platelet count decrease and the Cmax, Cmin, starting dose, and total dose within 4 weeks of treatment initiation (n = 21). There were correlations between the rate of platelet count decrease and the Cmax (r = 0.65, P = 0.001), starting dose (r = 0.63, P = 0.002), and total dose within 4 weeks (r = 0.62, P = 0.003). No significant correlation was found between the rate of platelet count decrease and the Cmin (r = 0.29, P = 0.206). The correlations between the rate of platelet count decrease and the Cmax as well as the starting dose were analyzed in patients with (n = 15) or without (n = 6) dose modifications (Fig. 3). A significant correlation was found between the rate of platelet count decrease and the Cmax (r = 0.84, P = 0.037) in patients without dose modifications within 4 weeks of treatment initiation (n = 6). Significant correlations were also found between the rate of platelet count decrease and the Cmax (r = 0.64, P = 0.011) as well as the starting dose (r = 0.65, P = 0.008) in patients with dose modifications within 4 weeks of treatment initiation (n = 15).
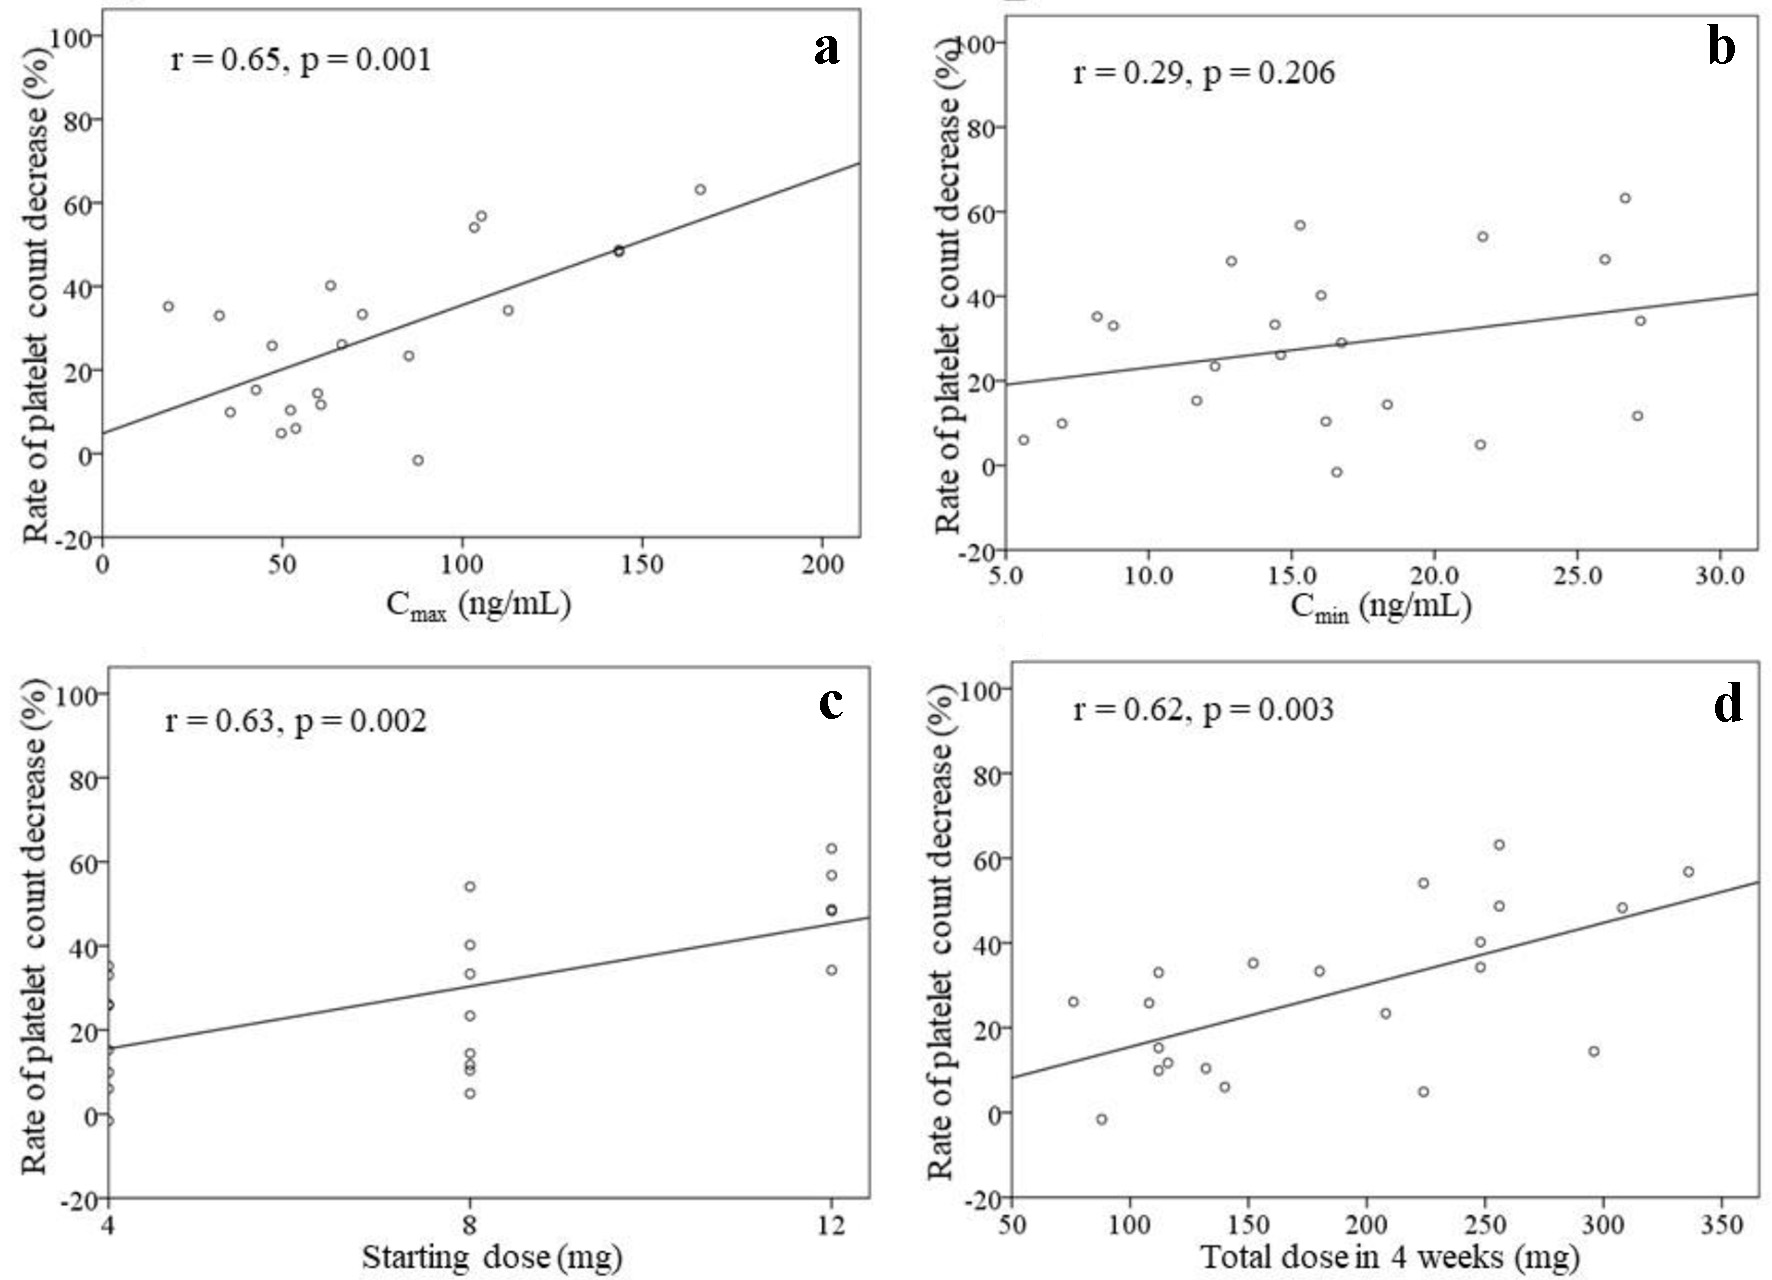 Click for large image | Figure 2. Rate of platelet count decrease, excluding two patients with drug withdrawal (n = 21). The correlations between the rate of platelet count decrease and the Cmax (a), Cmin (b), starting dose (c), and total dose of lenvatinib within 4 weeks of treatment initiation (d) are shown. |
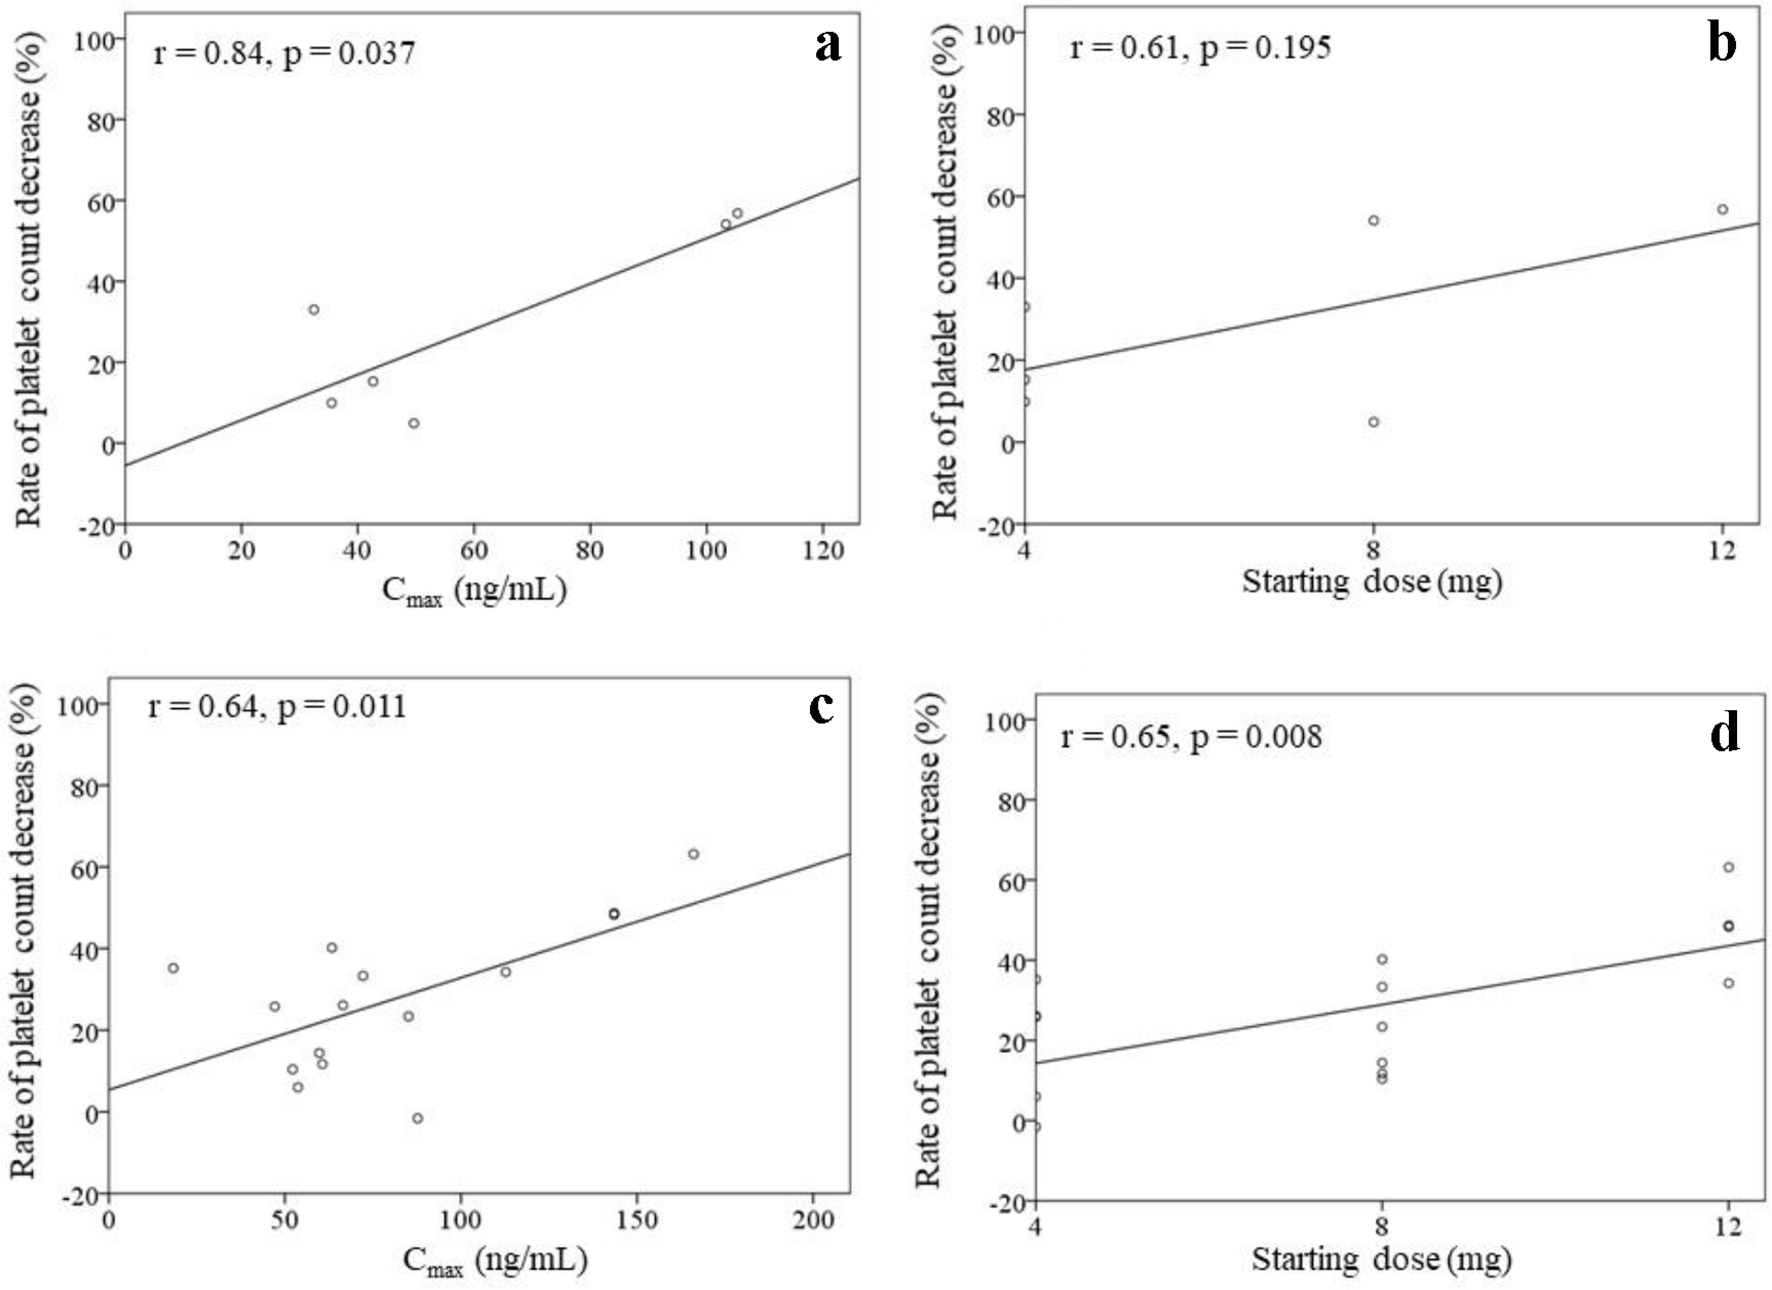 Click for large image | Figure 3. Rates of platelet count decrease in patients without dose modifications within 4 weeks (a, b) (n = 6) as well as in patients with dose modifications within 4 weeks (c, d) (n = 15) of lenvatinib initiation. The correlations between the rate of platelet count decrease and the Cmax as well as the starting dose of lenvatinib are shown. |
Creation of a Cmax prediction formula
The analysis to create a Cmax prediction formula that included patients who discontinued treatment (n = 23) was performed. The Cmax was strongly correlated with the starting dose of lenvatinib (r = 0.84, P < 0.0001). Stepwise multiple linear regression analysis was performed to create a formula for predicting the Cmax using the baseline characteristics (Table 1) as explanatory variables, excluding the body weight as it is closely related to the starting dose. The results demonstrated that the starting dose and the serum albumin value concentration were independent explanatory variables (Table 3). Therefore, the prediction formula was as follows: predicted Cmax (ng/mL) = (starting dose (mg) × 10.177) + (serum albumin value (g/dL) × 23.219) - 80.769. The predicted Cmax was strongly correlated with the Cmax (r = 0.87, P < 0.0001) for all patients (n = 23) as well as with the rate of platelet count decrease (r = 0.67, P = 0.001) for the patients without drug withdrawal (n = 21) (Fig. 4a, b). For the six patients without dose modifications, the rate of platelet count decrease tended to increase in the patients with a high predicted Cmax (r = 0.80, P = 0.053). For the 15 patients with dose modifications, the rate of platelet count decrease and the predicted Cmax were significantly correlated (r = 0.63, P = 0.012) (Fig. 4c, d).
Click to view | Table 3. Stepwise Multiple Linear Regression Analysis for Creating a Cmax Prediction Formula |
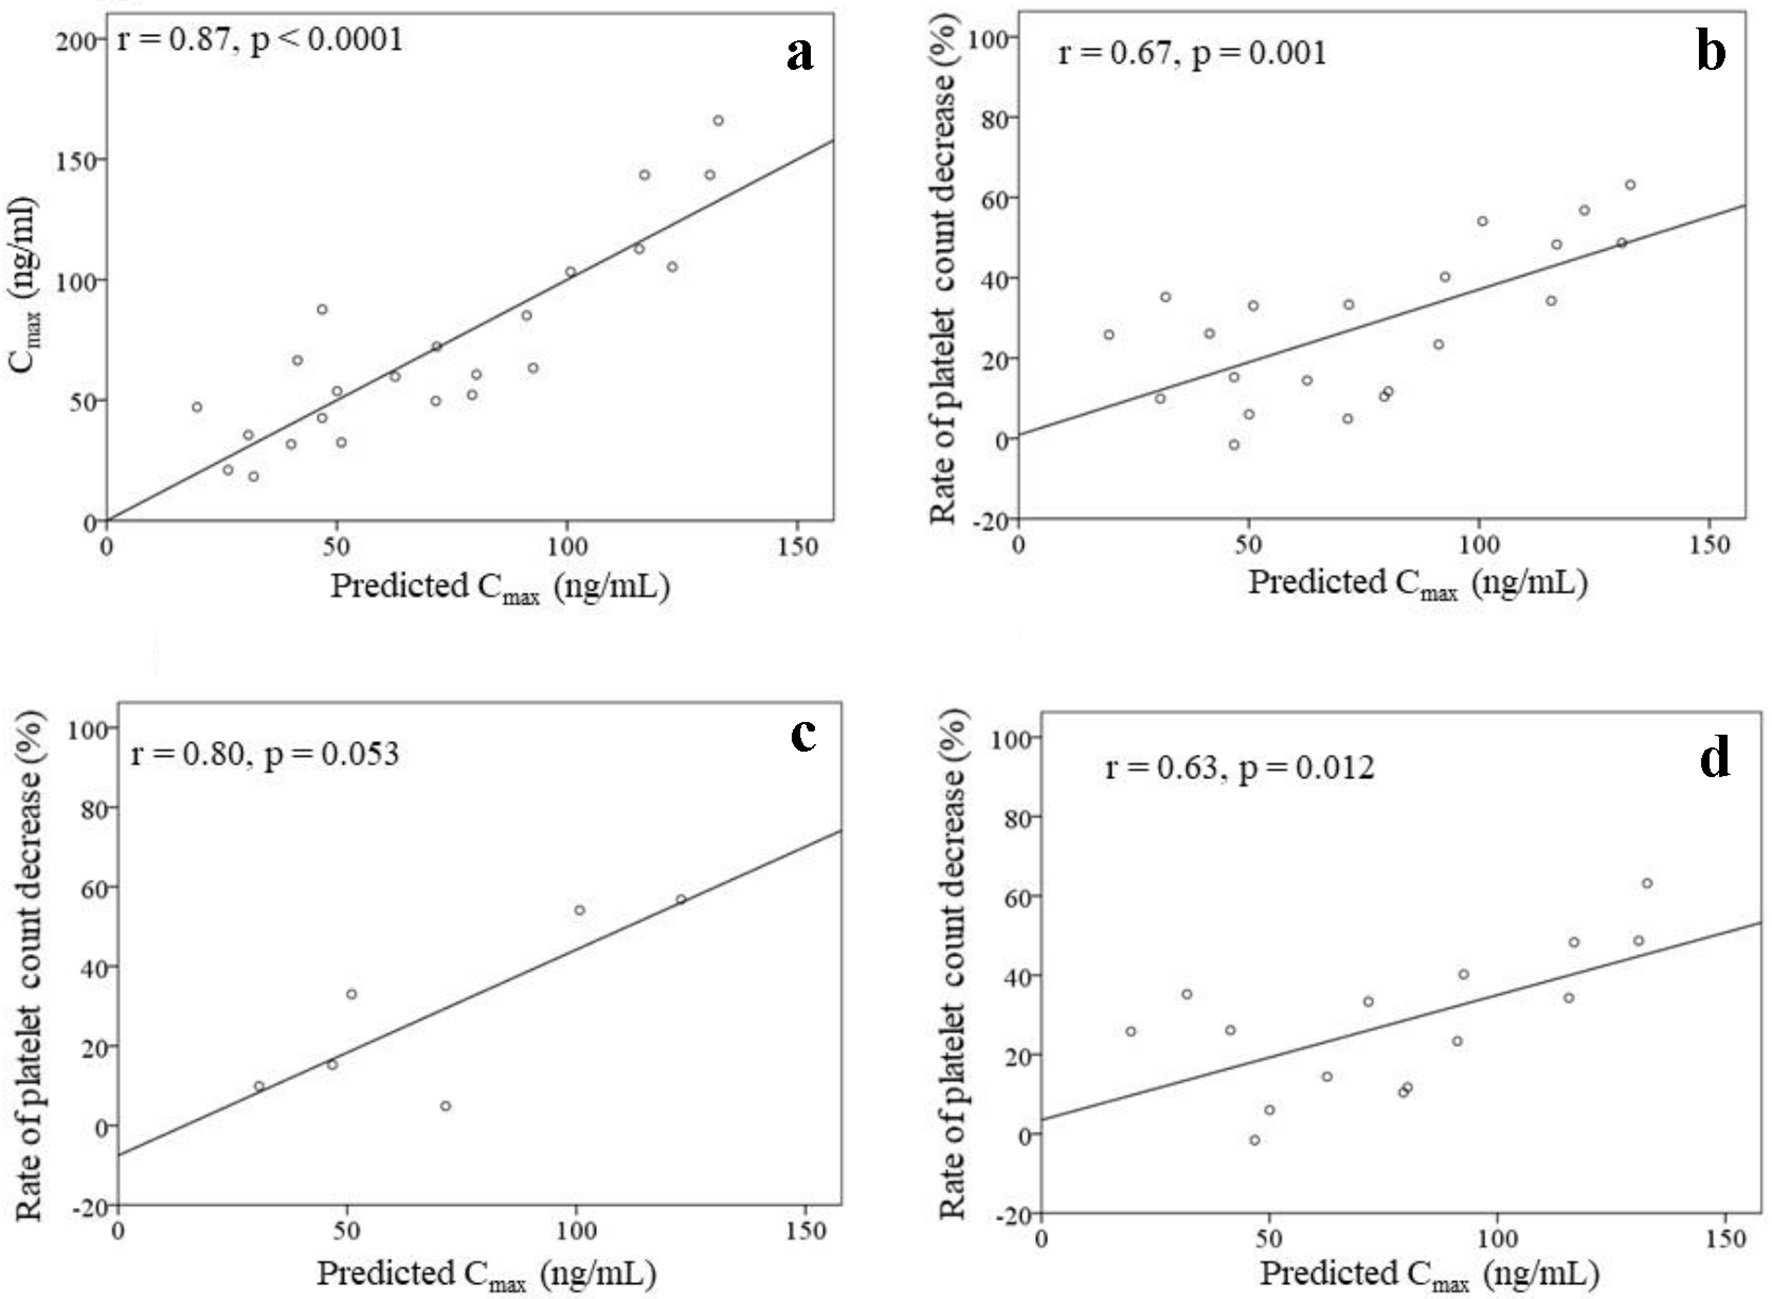 Click for large image | Figure 4. Correlation between the Cmax and the predicted Cmax (a) in all patients (n = 23). Correlations between the predicted Cmax and the rate of platelet count decrease (b-d). (b) Patients without drug withdrawal within 4 weeks of lenvatinib initiation (n = 21). (c) Patients without dose modifications within 4 weeks of lenvatinib initiation (n = 6). (d) Patients with dose modifications within 4 weeks of lenvatinib initiation (n = 15). |
Comparison of the patients with an albumin concentration < 3.5 g/dL (n = 11) and the patients with an albumin concentration ≥ 3.5 g/dL (n = 12) demonstrated that the Tmax was significantly longer in the group with an albumin concentration < 3.5 g/dL than in the group with an albumin concentration ≥ 3.5 g/dL group (Tmax: 7.5 ± 2.2 h vs. 5.0 ± 1.6 h, P = 0.006).
| Discussion | ▴Top |
Thrombocytopenia is a common side effect of lenvatinib treatment [10, 14, 15]. In a phase 3 study of lenvatinib (daily dose of 24 mg) for the treatment of radioiodine-refractory differentiated thyroid cancer, the incidence of thrombocytopenia was reported to be 8.8% (1.5%: grade ≥ 3) overall in the SELECT trial [13, 19] and 46.7% (grade ≥ 3: 6.7%) in Japanese patients [19]. In a phase 2 study of lenvatinib at a daily dose of 12 mg for advanced HCC, thrombocytopenia was observed in 34.8% of patients (grade ≥ 3: 21.8%) [15]. Meanwhile, in a randomized phase 3 trial (12 mg/day for a body weight ≥ 60 kg or 8 mg/day for a body weight < 60 kg), the incidence of thrombocytopenia was reported to be 18% (grade ≥ 3: 5%) in the lenvatinib group [10]. In our study, thrombocytopenia was the most frequently found AE, occurring in 52.2% (12/23) of the patients, and a dose reduction was needed in 21.7% (5/23) of the patients.
Our study revealed that the Cmax at the initial administration of lenvatinib was correlated with the rate of platelet count decrease within 4 weeks. The starting dose also was correlated with the rate of platelet count decrease because it was closely related to the Cmax. A previous dose-escalation study of lenvatinib has reported that the Cmax at the first administration and the Cmax at steady state were dose proportional [20]. In our study, among several variables, the Cmax at the first administration of lenvatinib was the most correlated with the rate of platelet count decrease. Since many patients had a dose change within 4 weeks of initiation of treatment, the total lenvatinib dose within the first 4 weeks of treatment was included in these variables. Furthermore, the Cmax also was correlated with the rate of platelet count decrease, even in patients with dose modifications.
This study identified the usefulness of the plasma lenvatinib concentration measurement to predict the platelet count decrease. However, since it is difficult to measure the plasma lenvatinib concentration in community hospitals, we created a prediction formula for Cmax using multiple regression analysis. This prediction formula consists of the starting dose of lenvatinib and the serum albumin concentration. In this study, the Tmax of lenvatinib in the group with a serum albumin concentration < 3.5 g/dL was longer than that in the group with a serum albumin concentration ≥ 3.5 g/dL; thus, absorption of lenvatinib by the intestinal tract may affect the Cmax. Lenvatinib may have an increased tissue migration in low serum albumin conditions due to the high binding rate of lenvatinib to serum proteins (96.6-98.2% in patients with advanced solid tumors) [20]. This formula using the starting dose of lenvatinib and the serum albumin concentration was strongly correlated with the Cmax; therefore, the predicted Cmax was useful for predicting the rate of platelet count decrease.
VEGFs play important roles in megakaryocytic cell lines [21]. During the development from hematopoietic stem cells to megakaryocytes, VEGFR1, VEGFR2, and VEGFR3 are expressed at different developmental stages [21]. Lenvatinib-induced thrombocytopenia may be caused by its inhibitory effect on VEGFRs in platelet formation. Therefore, a dose reduction or drug interruption is considered to be effective for recovery of the platelet count. The usefulness of partial splenic embolization (PSE) for patients with thrombocytopenia treated with lenvatinib has been reported [22]. If the rate of platelet count decrease can be predicted before lenvatinib treatment, PSE is a useful strategy to avoid a dose reduction or drug interruption.
This study has some limitations that must be mentioned. First, the number of patients analyzed was small. In addition, this study included patients who needed dose modifications within 4 weeks of treatment initiation. Therefore, the results of this study may not be sufficient to be generalizable.
Conclusion
The Cmax at the initial administration of lenvatinib correlated with the rate of platelet count decrease within 4 weeks. The predicted Cmax is useful for predicting the rate of platelet count decrease in HCC patients treated with lenvatinib.
Acknowledgments
Heartfelt appreciation goes to Sachiko Fujita whose clinical support was invaluable during the course of the study.
Financial Disclosure
None to declare.
Conflict of Interest
We have no financial relationships to disclose.
Informed Consent
Before the pharmacokinetics analysis, written informed consent was obtained from all 23 patients.
Author Contributions
Endo M performed the research and wrote the paper; Honda K designed the research and supervised the report; Honda K, Shiraiwa K, Sueshige Y, Tanaka R, Tatsuta R and Itoh H acquired and analyzed the data; Endo M, Honda K, Tokumaru T, Saito T, Iwao M, Tokoro M, Arakawa M and Seike M performed the clinical work; Murakami K supervised the report; all authors approved the final version of the article.
Data Availability
The authors declare that data supporting the findings of this study are available within the article.
| References | ▴Top |
- Torre LA, Bray F, Siegel RL, Ferlay J, Lortet-Tieulent J, Jemal A. Global cancer statistics, 2012. CA Cancer J Clin. 2015;65(2):87-108.
doi pubmed - Forner A, Reig M, Bruix J. Hepatocellular carcinoma. Lancet. 2018;391(10127):1301-1314.
doi - Colecchia A, Schiumerini R, Cucchetti A, Cescon M, Taddia M, Marasco G, Festi D. Prognostic factors for hepatocellular carcinoma recurrence. World J Gastroenterol. 2014;20(20):5935-5950.
doi pubmed - Yang SL, Luo YY, Chen M, Zhou YP, Lu FR, Deng DF, Wu YR. A systematic review and meta-analysis comparing the prognosis of multicentric occurrence and vs. intrahepatic metastasis in patients with recurrent hepatocellular carcinoma after hepatectomy. HPB (Oxford). 2017;19(10):835-842.
doi pubmed - Tateishi R, Uchino K, Fujiwara N, Takehara T, Okanoue T, Seike M, Yoshiji H, et al. A nationwide survey on non-B, non-C hepatocellular carcinoma in Japan: 2011-2015 update. J Gastroenterol. 2019;54(4):367-376.
doi pubmed - Hsu PY, Hsu CT, Yeh ML, Huang CF, Huang CI, Liang PC, Lin YH, et al. Early fibrosis but late tumor stage and worse outcomes in hepatocellular carcinoma patients without hepatitis B or hepatitis C. Dig Dis Sci. 2020;65(7):2120-2129.
doi pubmed - Lanza E, Donadon M, Poretti D, Pedicini V, Tramarin M, Roncalli M, Rhee H, et al. Transarterial therapies for hepatocellular carcinoma. Liver Cancer. 2016;6(1):27-33.
doi pubmed - Hiraoka A, Kumada T, Kudo M, Hirooka M, Koizumi Y, Hiasa Y, Tajiri K, et al. Hepatic function during repeated TACE procedures and prognosis after introducing sorafenib in patients with unresectable hepatocellular carcinoma: multicenter analysis. Dig Dis. 2017;35(6):602-610.
doi pubmed - Llovet JM, Ricci S, Mazzaferro V, Hilgard P, Gane E, Blanc JF, de Oliveira AC, et al. Sorafenib in advanced hepatocellular carcinoma. N Engl J Med. 2008;359(4):378-390.
doi pubmed - Kudo M, Finn RS, Qin S, Han KH, Ikeda K, Piscaglia F, Baron A, et al. Lenvatinib versus sorafenib in first-line treatment of patients with unresectable hepatocellular carcinoma: a randomised phase 3 non-inferiority trial. Lancet. 2018;391(10126):1163-1173.
doi - Matsui J, Yamamoto Y, Funahashi Y, Tsuruoka A, Watanabe T, Wakabayashi T, Uenaka T, et al. E7080, a novel inhibitor that targets multiple kinases, has potent antitumor activities against stem cell factor producing human small cell lung cancer H146, based on angiogenesis inhibition. Int J Cancer. 2008;122(3):664-671.
doi pubmed - Tohyama O, Matsui J, Kodama K, Hata-Sugi N, Kimura T, Okamoto K, Minoshima Y, et al. Antitumor activity of lenvatinib (e7080): an angiogenesis inhibitor that targets multiple receptor tyrosine kinases in preclinical human thyroid cancer models. J Thyroid Res. 2014;2014:638747.
doi pubmed - Schlumberger M, Tahara M, Wirth LJ, Robinson B, Brose MS, Elisei R, Habra MA, et al. Lenvatinib versus placebo in radioiodine-refractory thyroid cancer. N Engl J Med. 2015;372(7):621-630.
doi pubmed - Ikeda M, Okusaka T, Mitsunaga S, Ueno H, Tamai T, Suzuki T, Hayato S, et al. Safety and pharmacokinetics of lenvatinib in patients with advanced hepatocellular carcinoma. Clin Cancer Res. 2016;22(6):1385-1394.
doi pubmed - Ikeda K, Kudo M, Kawazoe S, Osaki Y, Ikeda M, Okusaka T, Tamai T, et al. Phase 2 study of lenvatinib in patients with advanced hepatocellular carcinoma. J Gastroenterol. 2017;52(4):512-519.
doi pubmed - Tamai T, Hayato S, Hojo S, Suzuki T, Okusaka T, Ikeda K, Kumada H. Dose finding of lenvatinib in subjects with advanced hepatocellular carcinoma based on population pharmacokinetic and exposure-response analyses. J Clin Pharmacol. 2017;57(9):1138-1147.
doi pubmed - European Association for the Study of the Liver; European Organisation for Research and Treatment of Cancer. EASL-EORTC clinical practice guidelines: management of hepatocellular carcinoma. J Hepatol. 2012;56(4):908-943.
doi pubmed - Sueshige Y, Shiraiwa K, Honda K, Tanaka R, Saito T, Tokoro M, Iwao M, et al. A broad range high-throughput assay for lenvatinib using ultra-high performance liquid chromatography coupled to tandem mass spectrometry with clinical application in patients with hepatocellular carcinoma. Ther Drug Monit. 2021;43(5):664-671.
doi pubmed - Kiyota N, Schlumberger M, Muro K, Ando Y, Takahashi S, Kawai Y, Wirth L, et al. Subgroup analysis of Japanese patients in a phase 3 study of lenvatinib in radioiodine-refractory differentiated thyroid cancer. Cancer Sci. 2015;106(12):1714-1721.
doi pubmed - Yamada K, Yamamoto N, Yamada Y, Nokihara H, Fujiwara Y, Hirata T, Koizumi F, et al. Phase I dose-escalation study and biomarker analysis of E7080 in patients with advanced solid tumors. Clin Cancer Res. 2011;17(8):2528-2537.
doi pubmed - Yang JG, Wang LL, Ma DC. Effects of vascular endothelial growth factors and their receptors on megakaryocytes and platelets and related diseases. Br J Haematol. 2018;180(3):321-334.
doi pubmed - Sato N, Beppu T, Kinoshita K, Yuki H, Suyama K, Yuruki H, Motohara T, et al. Partial splenic embolization for lenvatinib therapy-associated thrombocytopenia among patients with hepatocellular carcinoma. Anticancer Res. 2019;39(12):6895-6901.
doi pubmed
This article is distributed under the terms of the Creative Commons Attribution Non-Commercial 4.0 International License, which permits unrestricted non-commercial use, distribution, and reproduction in any medium, provided the original work is properly cited.
World Journal of Oncology is published by Elmer Press Inc.