

| World Journal of Oncology, ISSN 1920-4531 print, 1920-454X online, Open Access |
| Article copyright, the authors; Journal compilation copyright, World J Oncol and Elmer Press Inc |
| Journal website https://www.wjon.org |
Original Article
Volume 13, Number 6, December 2022, pages 387-402

Glycine Decarboxylase Suppresses the Renal Cell Carcinoma Growth and Regulates Its Gene Expressions and Functions
Ye Da Chena, b, Ke Xin Gaob, Zhu Wangb, Qiong Dengb, Yu Ting Chenc, d, Hui Liangb, d
aShenzhen Institute of Advanced Technology, Chinese Academy of Sciences, Shenzhen 518055, China
bDepartment of Urology, Affiliated Longhua People’s Hospital, Southern Medical University (Longhua People’s Hospital), Shenzhen 518109, China
cKey Laboratory of Environmental Medicine, School of Public Health, Guangdong Medical University, Dongguan, China
dCorresponding Author: Yu Ting Chen, Key Laboratory of Environmental Medicine, School of Public Health, Guangdong Medical University, Dongguan, China; Hui Liang, Department of Urology, Affiliated Longhua People’s Hospital, Southern Medical University (Longhua People’s Hospital), Shenzhen 518109, China
Manuscript submitted October 22, 2022, accepted November 8, 2022, published online December 1, 2022
Short title: GLDC Suppresses the Growth of RCC Cells
doi: https://doi.org/10.14740/wjon1539
| Abstract | ▴Top |
Background: Glycine decarboxylase (GLDC), a key metabolic enzyme, participates in the regulation of the glycine metabolic pathway. Differential expression of GLDC is linked to the malignant growth of renal cell carcinoma (RCC) and may regulate tumor progression through other genes. However, the regulatory function of GLDC in RCC is currently unknown. The purpose of this work was to evaluate the roles of GLDC in the invasion, proliferation, and migration of RCC cells and elucidate the processes underlying RCC development.
Methods: The expression of GLDC in RCC cell lines and tissues was identified by quantitative reverse transcription polymerase chain reaction (PCR) and western blot. A stably transfected cell line overexpressing GLDC was constructed using a lentiviral vector. Cell proliferation was detected using Cell Counting Kit-8 (CCK8) and EdU experiments, and scratch and transwell assays were used to determine migration and invasion capabilities. Furthermore, differential proteins were identified and obtained using high-performance liquid chromatography (HPLC)-tandem mass spectrometry (MS/MS) analysis. Finally, these differential proteins were analyzed by bioinformatics, including cluster analysis, subcellular localization, domain annotation, annotation of the Gene Ontology (GO) and the Kyoto Encyclopedia of Genes and Genomes (KEGG), enrichment analysis, and study of protein-protein interactions.
Results: GLDC expression was found to be lower in six RCC cell lines (786-O, A498, Caki-1, 769-P, OSRC-2, and ACHN) than in 293T cells and decreased in kidney cancer tissues compared to neighboring normal tissues. Overexpression of GLDC inhibited the proliferation of RCC cells as well as their migration and invasion abilities. Tandem mass tag analysis showed that 317 and 236 genes were downregulated and upregulated, respectively, when GLDC was overexpressed in A498 cells. Tandem mass tag analysis showed that 317 and 236 genes were downregulated and upregulated, respectively, when GLDC was overexpressed in A498 cells. Volcano plot showed these upregulated and downregulated proteins. Cluster analysis showed that differentially expressed protein screening can represent the effect of biological treatment on samples. Subcellular localization analysis showed differential proteins are mainly distributed in the nucleus, cytoplasm, mitochondria, plasma membrane, extracellular matrix, and lysosome. GO annotation showed many biological processes in the cells were changed, including “positive regulation of histone H3-K4 methylation”, “cofactor binding”, and “nuclear body”. KEGG pathway analysis showed key pathways have all undergone considerable alterations, such as “cell cycle”, “glyoxylate and dicarboxylate metabolism”, and “threonine, glycine, and serine metabolism”. Finally, highly aggregated proteins with the same or similar functions were acquired by analysis of the protein-protein interaction (PPI) network.
Conclusions: These studies indicate that GLDC overexpression suppresses the invasion, proliferation, and migration of RCC cells and leads to the upregulation and downregulation of 236 and 317 genes, respectively.
Keywords: GLDC; Malignant growth; Renal cell carcinoma; Bioinformatics analysis
| Introduction | ▴Top |
Renal cancer accounts for more than 90% of all renal tumors and 3-4% of adult malignant tumors [1]. In recent years, there has been a discernible rise in the rate at which patients are diagnosed with renal cell carcinoma (RCC) [2, 3]. Therefore, early detection, diagnosis, and treatment are particularly important. Surgery remains the primary treatment for RCC. Given the emergence and development of precision medicine, individualized therapy for RCC has gradually been recognized in clinical practice. However, as most RCCs undergo metastasis, in-depth investigations are needed to establish more effective treatment methods.
The pathogenesis of RCC is complex and includes tumor cell multiplication, migration, and invasion [4, 5]. Multiple genes are expressed aberrantly during the development of cancers [6]. Changes in single-gene expression can induce the abnormal expression of other genes. Therefore, the chain reaction caused by the abnormality of a single gene indirectly leads to tumor occurrence. In this study, our experiment confirmed that the expression of glycine decarboxylase (GLDC) decreased in RCC. The biological activity of RCC cells is altered by aberrant expression of GLDC, leading to an imbalance in the expression of other genes. The abnormal expression of multiple genes can alter biological processes in vivo, which, in turn, can lead to disease occurrence.
The glycine metabolic system, which is composed of four different subunits (P, T, H, and L proteins), executes glycine metabolism. The P protein is GLDC reliant on pyridoxal phosphate [7]. The glycine cleavage system (GCS) contains a protein known as GLDC, which is a P protein. GLDC is an enzyme that predominantly resides in mitochondria, catalyzes the oxidative decarboxylation and deamination of glycine, and plays a primary role in the amino acid metabolism of cellular organisms [8]. The metabolic process of cancer cells is distinctive, and GLDC is a gene involved in metabolism. Therefore, abnormal GLDC expression may lead to tumorigenesis. GLDC was found to be highly expressed in melanoma and weakly expressed in gastric cancer [9, 10], thereby indicating that GLDC expression in different tumors is inconsistent. We have not determined how GLDC affects the occurrence and development of RCC and which genes are abnormally expressed when GLDC is overexpressed. Therefore, this research sought to determine the function of GLDC in RCC cell biological behavior, as well as the abnormal gene expression induced by GLDC overexpression. In this study, we aimed to provide a biological basis for elucidating the pathogenesis of RCC. No earlier research has studied the involvement of GLDC in RCC, as far as we are aware. Therefore, in this particular work, through the use of tandem mass tag (TMT) analysis, our study was able to explore the part that GLDC plays in the proliferation, invasion, and migration of RCC cells and elucidate the processes underlying RCC development.
| Materials and Methods | ▴Top |
Institutional Review Board statement
The study was conducted in accordance with the Declaration of Helsinki and approved by the Ethics Committee of the Affiliated Longhua People’s Hospital, Southern Medical University (No. 2022/117).
Pathology specimens
Patients who had surgery at the Longhua District People’s Hospital in Shenzhen provided samples of both RCC and healthy tissues, which were collected and analyzed. Then they were transferred, frozen in liquid nitrogen, and kept in a refrigerator at -80 °C.
Reagents
RPMI-1640 media was purchased from Gibco Thermo Fisher Scientific (America). Biological industries were able to provide us with fetal bovine serum (FBS). Anti-GLDC (#12794) was purchased from Cell Signaling Technology. Anti-GADPH was obtained from Affinity Biosciences with the product number AFF389-50. Bioss Antibodies was the supplier of the secondary antibody, which was anti-rabbit immunoglobulin G (IgG) and had the catalog number bs-0295G-HRP.
Transfection and cell culture
The cell bank of the Chinese Academy of Sciences in Shanghai supplied the researchers with RCC cell lines including 786-O, A498, Caki-1, 769-P, OSRC-2, and ACHN. The cells were grown in a medium consisting of RPMI-1640 that had been augmented with 10% FBS. Following that, the cells were subjected to an incubation process at 37 °C in an atmosphere that was humidified and included 5% carbon dioxide. The Shanghai Gene Pharmaceutical Co., Ltd. in Shanghai, China was the source of the lentivirus that was used in the process of altering the cells. After the cells had been transformed, they were extracted and subjected to western blot and PCR.
Real-time polymerase chain reaction quantification (RT-qPCR)
To extract total RNA, a commercial kit manufactured by Fastgene, Inc. and listed under catalog number 220010 was used, and a Prime kit manufactured by Takara Bio Inc. was used in order to convert the RNA that had been extracted into cDNA. The primers are utilized in the following sequence: forward GLDC is 5'-CCAGACACGACGACTTCGC-3'; reverse GLDC is 5'-CAATTCATCAATGCTCGCCAG-3'. Forward GAPDH is 5'-AAGAAGGTGGTGAAGCAGG-3'; reverse GAPDH is 5'-GTCAAAGGTGGAGGAGTGG-3'.
Western blotting
RIPA lysis buffer was used to lyse cell lysates for 10 min at 4 °C, and Coomassie brilliant blue technique has been employed to determine protein content. The sample has been added with sample buffer, heated for 10 min, 95 ℃, followed by 2 h of electrophoretic separation using a polyacrylamide-sodium dodecyl sulfate gel with a 10% concentration. Following transfer of the proteins to a PVDF membrane, the membrane was blocked for 2 h at room temperature with 5% skim milk. Incubation of the membranes took place at 4 °C overnight with the primary antibody, and then at room temperature for 2 h with a 1:10,000 dilution of the secondary antibody the following day. Membranes were scanned using the appropriate device, and densitometric analysis of the bands was carried out utilizing Image J software for gray-scale investigation.
Cell viability assay
After planting 5,000 cells into each well of a 96-well plate, the cell viability was measured at 0, 24, 48, 72, 96, and 128 h using a Cell Counting Kit-8 (CCK8) assay kit. The results were presented as a percentage (Dojindo, Japan).
Cell proliferation assay
A kit for detecting EdU cell proliferation was used to find the proliferation of cells (Ribobio, Guangzhou). Cells were briefly fixed after 2 h of incubation with 50 µM EdU. Nuclei were counterstained with Hoechst (1 µg/mL) for 30 min. Cells were observed using fluorescence microscopy, and the amount of cells stained with EdU has been quantified.
Invasion experiment and transwell migration
Following the digestion of the cells with trypsin, they were resuspended in a total volume of 500 µL of RPMI-1640 media. The cellular counter was utilized to measure the density of the cell. A transwell membrane with an 8 µm micropore diameter was coated with Matrigel adhesive for the purpose of evaluating the cells’ capacity for invasion. The top cavity of the transwell chamber was populated with a total of 2 × 10⁴ cells, and the bottom cavity was filled with 750 µL of RPMI-1640 medium that had been augmented with 10% FBS. The temperature within the chamber was consistent with that of the surrounding air and the cells in the top cavity had been delicately removed following 24 h through a cotton swab. Afterward, the cells were fixed with paraformaldehyde at a concentration of 4% for 10 min while they were allowed to remain at room temperature followed by staining with crystal violet for 10 min. Following the drying of filter membrane, a microscope was used to observe the small cells that were invading and migrating.
Wound healing assay
Prior to being infused into six-well plates and cultured for an overnight period, cells were counted and digested. A 200-μL pipette tip was employed for scraping the monolayer cells, and an optical microscope was used to photograph them. A cell incubator was used to incubate the six-well plates at 37 °C for a period of 24 h, and it was photographed after evaluating the healing process.
Quantitation and identification of proteins
The MASCOT engine v. 2.2 (Matrix Science, London, UK) incorporated inside the Proteome Discoverer 1.4 software searched the MS raw data for each sample. This was done so that quantitation and identification analyses could be performed.
Cluster analysis
Hierarchical clustering analysis was carried out using Java Treeview and Cluster 3.0. For similarity measurement, we chose the Euclidean distance technique; and for clustering, the average linkage clustering method was chosen (which employs the centroids of the data). Apart from the dendrogram, a heat map is shown as a visual aid.
Subcellular localization
All differentially expressed proteins’ subcellular localization was examined employing the CELLO subcellular structure prediction software. At the same time, the number and distribution ratio of proteins in each sub-organelle were displayed in pie chart.
Domain annotation
In order to recognize protein domain signatures, the protein sequences were analyzed using the program InterProScan and the Pfam database that is a part of InterPro.
Gene Ontology (GO) annotation
In order to locate homologous sequences, utilizing InterProScan and NCBI BLAST+ client software, the sequences of a selection of proteins that exhibited differential expression were examined. Next, the Blast2GO program was used to map GO keywords and annotate sequences. R scripts were used to visualize the GO annotation findings.
Kyoto Encyclopedia of Genes and Genomes (KEGG) annotation
After the annotation phases were complete, the studied proteins were blasted against the online database of KEGG to get their KEGG Orthology identifiers (IDs). After that, the analyzed proteins were mapped to pathways within KEGG.
Evaluation of enrichment
Fisher’s exact test was used to guide the application of enrichment analysis, which used the entire quantified protein dataset as its background. To account for the effects of multiple tests, the Benjamini-Hochberg correction was used. The obtained P values were further adjusted. Only pathways and functional groupings with P values < 0.05 were deemed substantial.
Protein-protein interaction (PPI) analysis
By using their STRING or gene symbols software, the proteins’ PPI networks were established using information from the IntAct molecular interaction database. The results have been downloaded in the XGMML format, and the application Cytoscape has been included into it for the purpose of viewing and study of functional PPI networks.
Statistical analysis
SPSS 23.0 (IBM Corp) was employed for examining all the data. In order to compare the two groups, a t-test was carried out. One-way analysis of variance (ANOVA) test with Bonferroni correction for multiple testing was employed for evaluating the disparity between multiple groupings. P values that were less than 0.05 were used to indicate statistical significance.
| Results | ▴Top |
Protein expression and messenger RNA (mRNA) level of the GLDC in RCC cell lines and tissue specimens from humans
According to RT-qPCR analysis, the levels of GLDC expression that are comparable across the six RCC cell lines (786-O, A498, Caki-1, 769-P, OSRC-2, and ACHN) were reduced in contrast to that in the kidney cell line 293T (Fig. 1a). Additionally, protein expression levels and GLDC mRNA were detected in cancer as well as adjacent tissue specimens of three patients via western blotting and RT-qPCR. GLDC protein and mRNA were reduced in cancer tissues in comparison to adjacent healthy tissues (Fig. 1b-d).
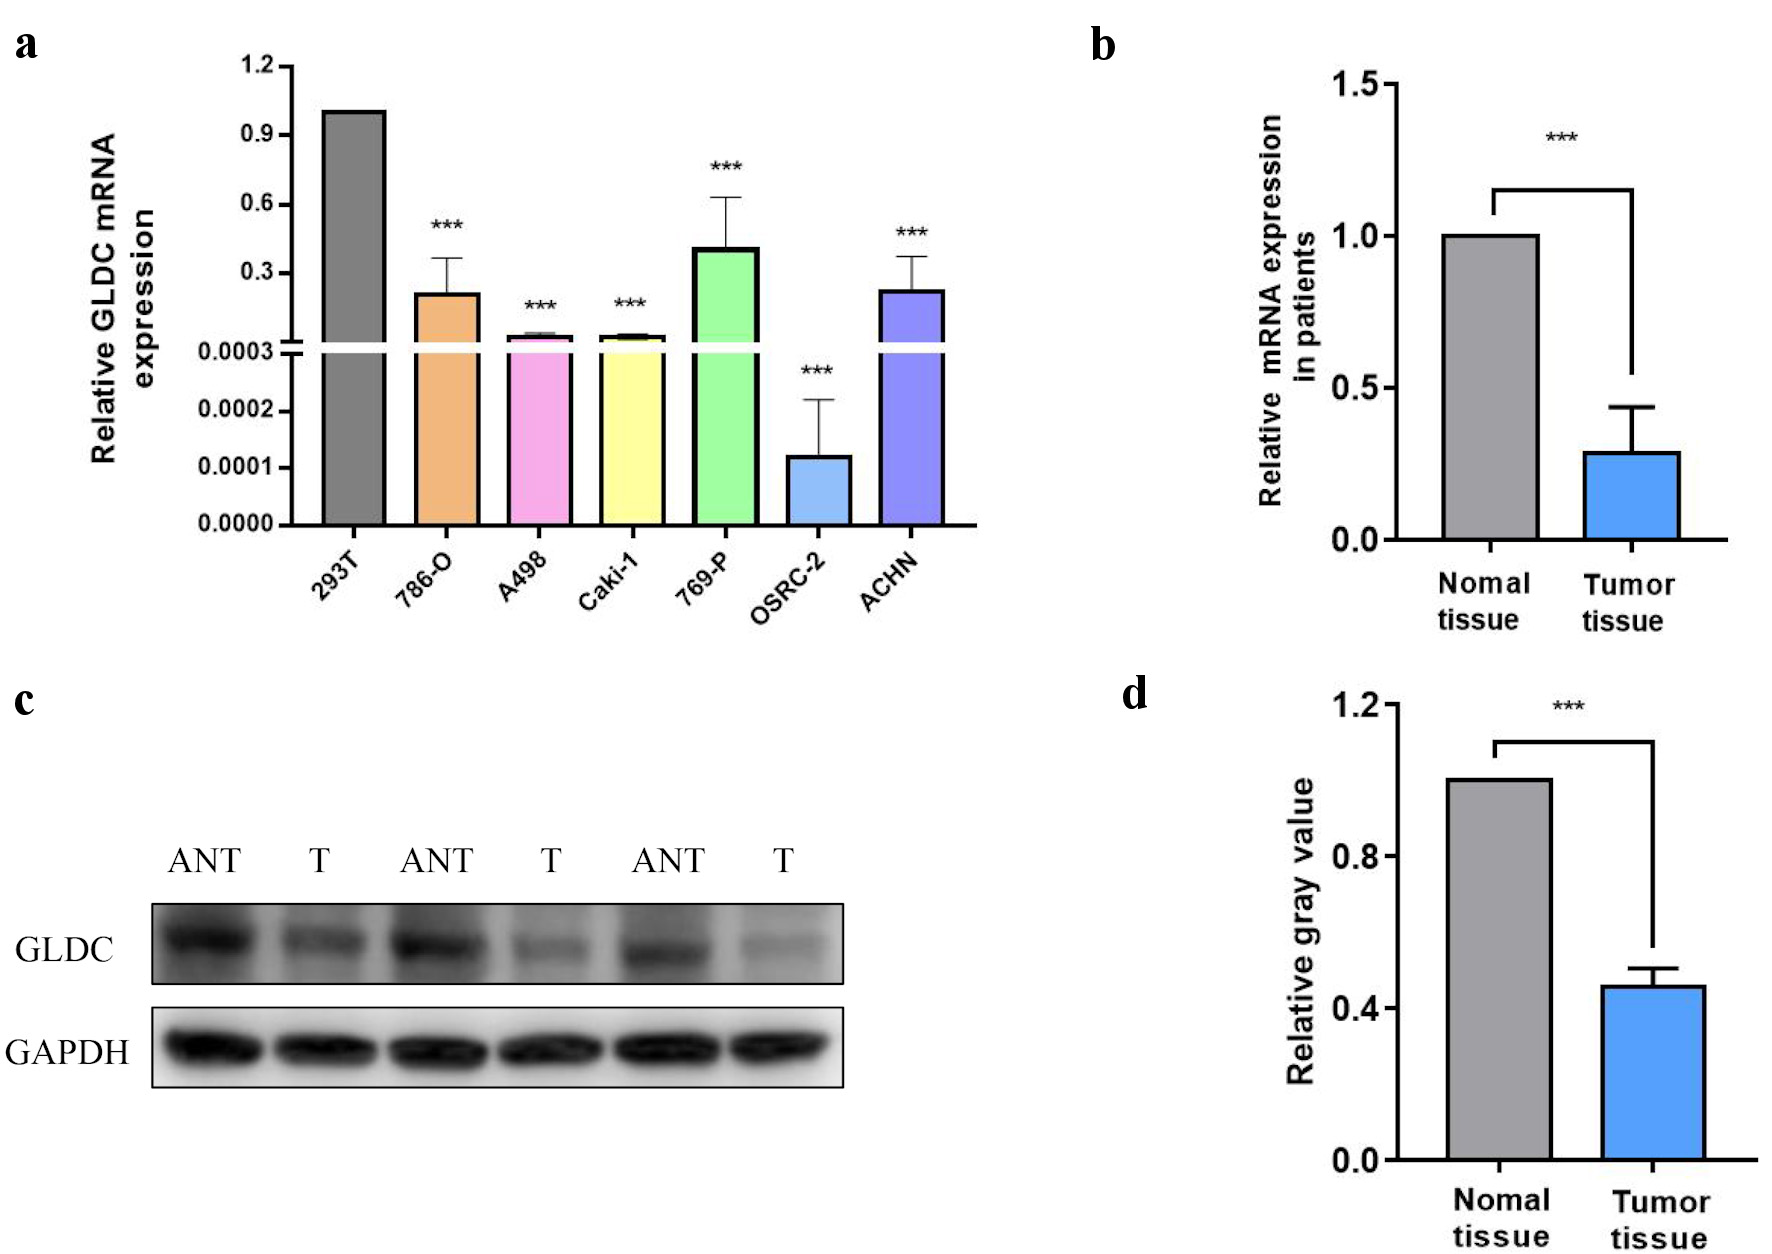 Click for large image | Figure 1. Protein and messenger RNA (mRNA) levels of glycine decarboxylase (GLDC). (a) Relative mRNA expression of GLDC in renal cell carcinoma (RCC) cell lines. (b) Relative mRNA expression of GLDC in normal and RCC primary tumor tissues. (c) GLDC protein expression in tumor tissues (T) and RCC adjacent non-neoplastic tissues (ANT). (d) Quantification of protein expression in (c). *P < 0.05, **P < 0.01, ***P < 0.001. |
Overexpression of GLDC in RCC cell lines
To further evaluate the function of GLDC in RCC cells, we overexpressed GLDC in A498 and 786-O cell lines. Using RT-qPCR and western blotting, we confirmed that GLDC-transfection leads to increased protein levels and GLDC mRNA in A498 and 786-O cells (Fig. 2a-c).
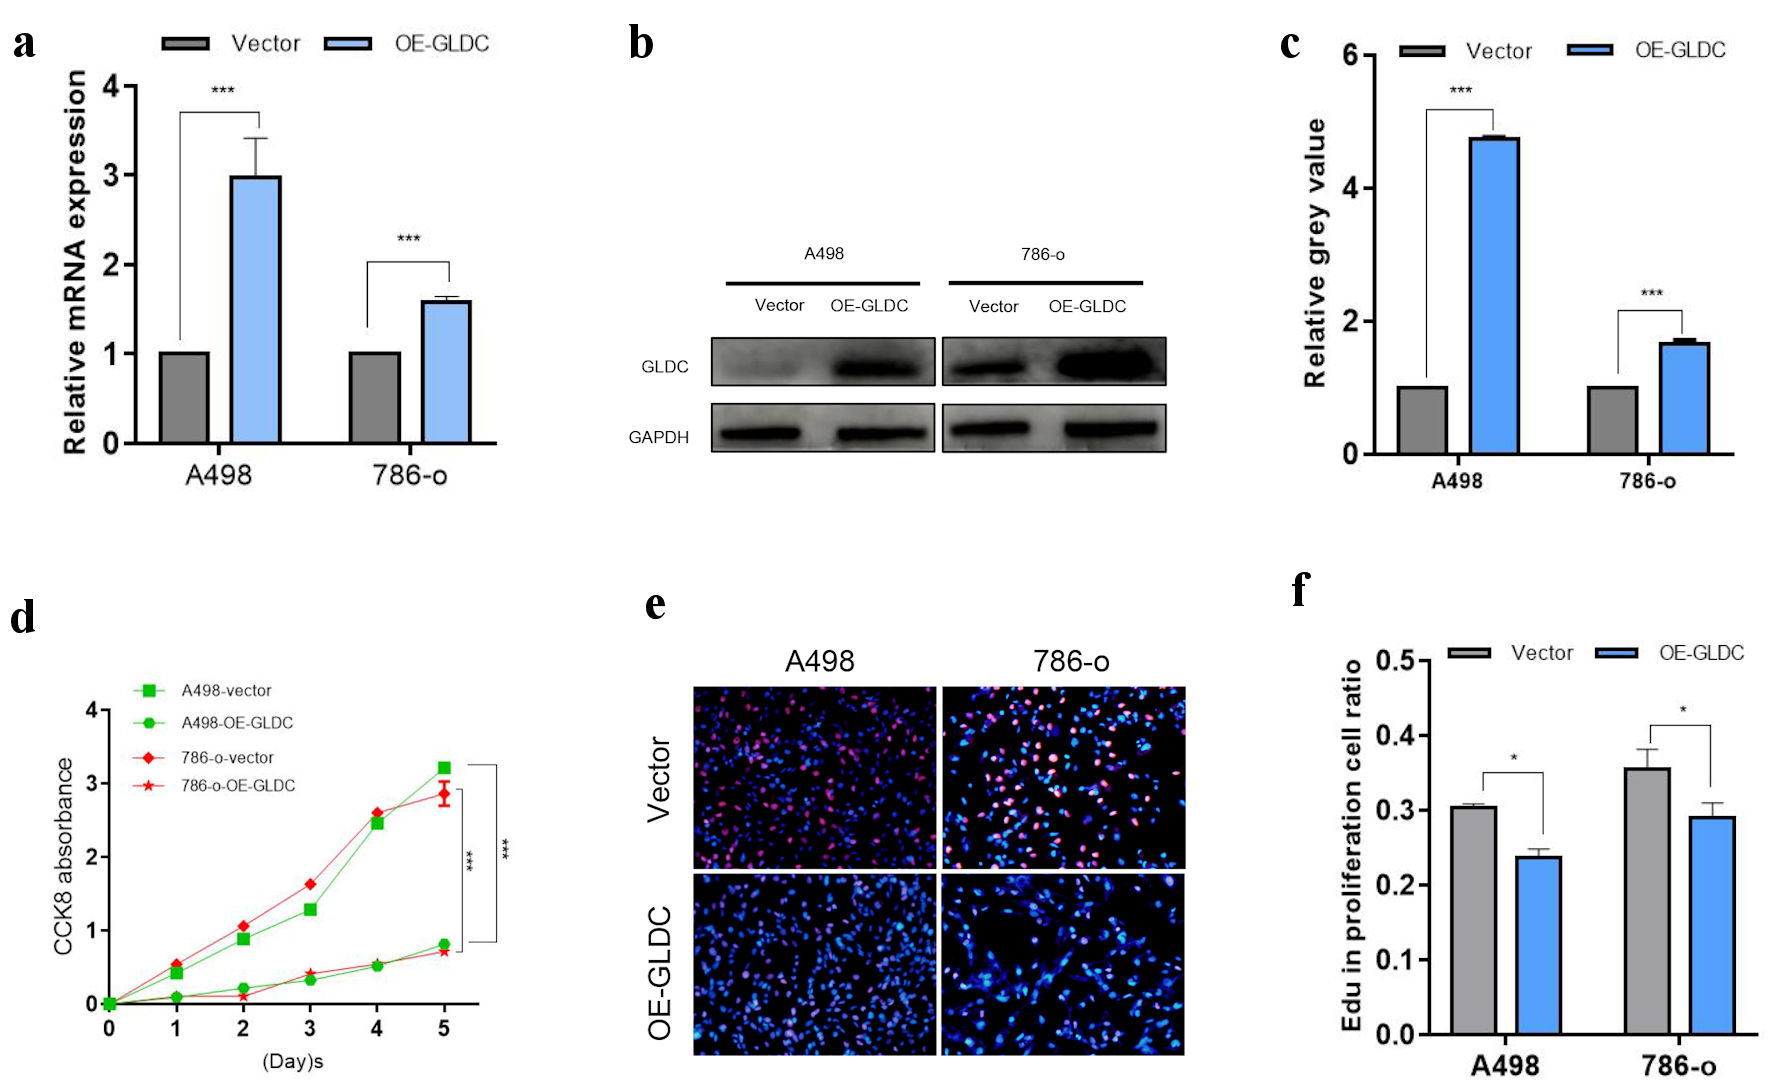 Click for large image | Figure 2. Glycine decarboxylase (GLDC) inhibits renal cell carcinoma (RCC) cell growth. (a) Relative mRNA expression in GLDC-overexpressing RCC cell lines. (b) Protein expression in GLDC-overexpressing RCC cell lines. (c) Quantification of protein expression in (b). (d) Growth curves of A498 and 786-O cells. (e) Cell viability detected using the EdU assay. The blue fluorescence was Hoechst stains and the red fluorescence was EdU labeled proliferating cells. (f) Quantification of proliferating cell ratio. *P < 0.05, **P < 0.01, ***P < 0.001 |
RCC growth is inhibited by GLDC overexpression
According to the results of CCK8 and EdU assays, GLDC overexpression decreased the viability of A498 and 786-O cell lines compared to non-transfected cells (Fig. 2d-f).
Overexpression of GLDC limits RCC migration and invasion
A wound healing assay has been employed for detecting cell’s migration and invasion capability. Overexpression of GLDC in A498 and 786-O cells reduced the cell’s migration and invasion capability for 24 h following the scratch than the control group (Fig. 3a, b). Additionally, cell migration and invasion ability were assessed using a transwell migration and invasion assay. Crystal violet was used to label migratory cells after the transwell chamber had been used for cell growth for a full 24 h. These cells had already gone through the micropores. In contrast to the group serving as the control, the overexpression group of GLDC had a much lower number of cells that passed through the micropores (Fig. 3c-f), further confirming that overexpression of GLDC inhibits cell migration and invasion.
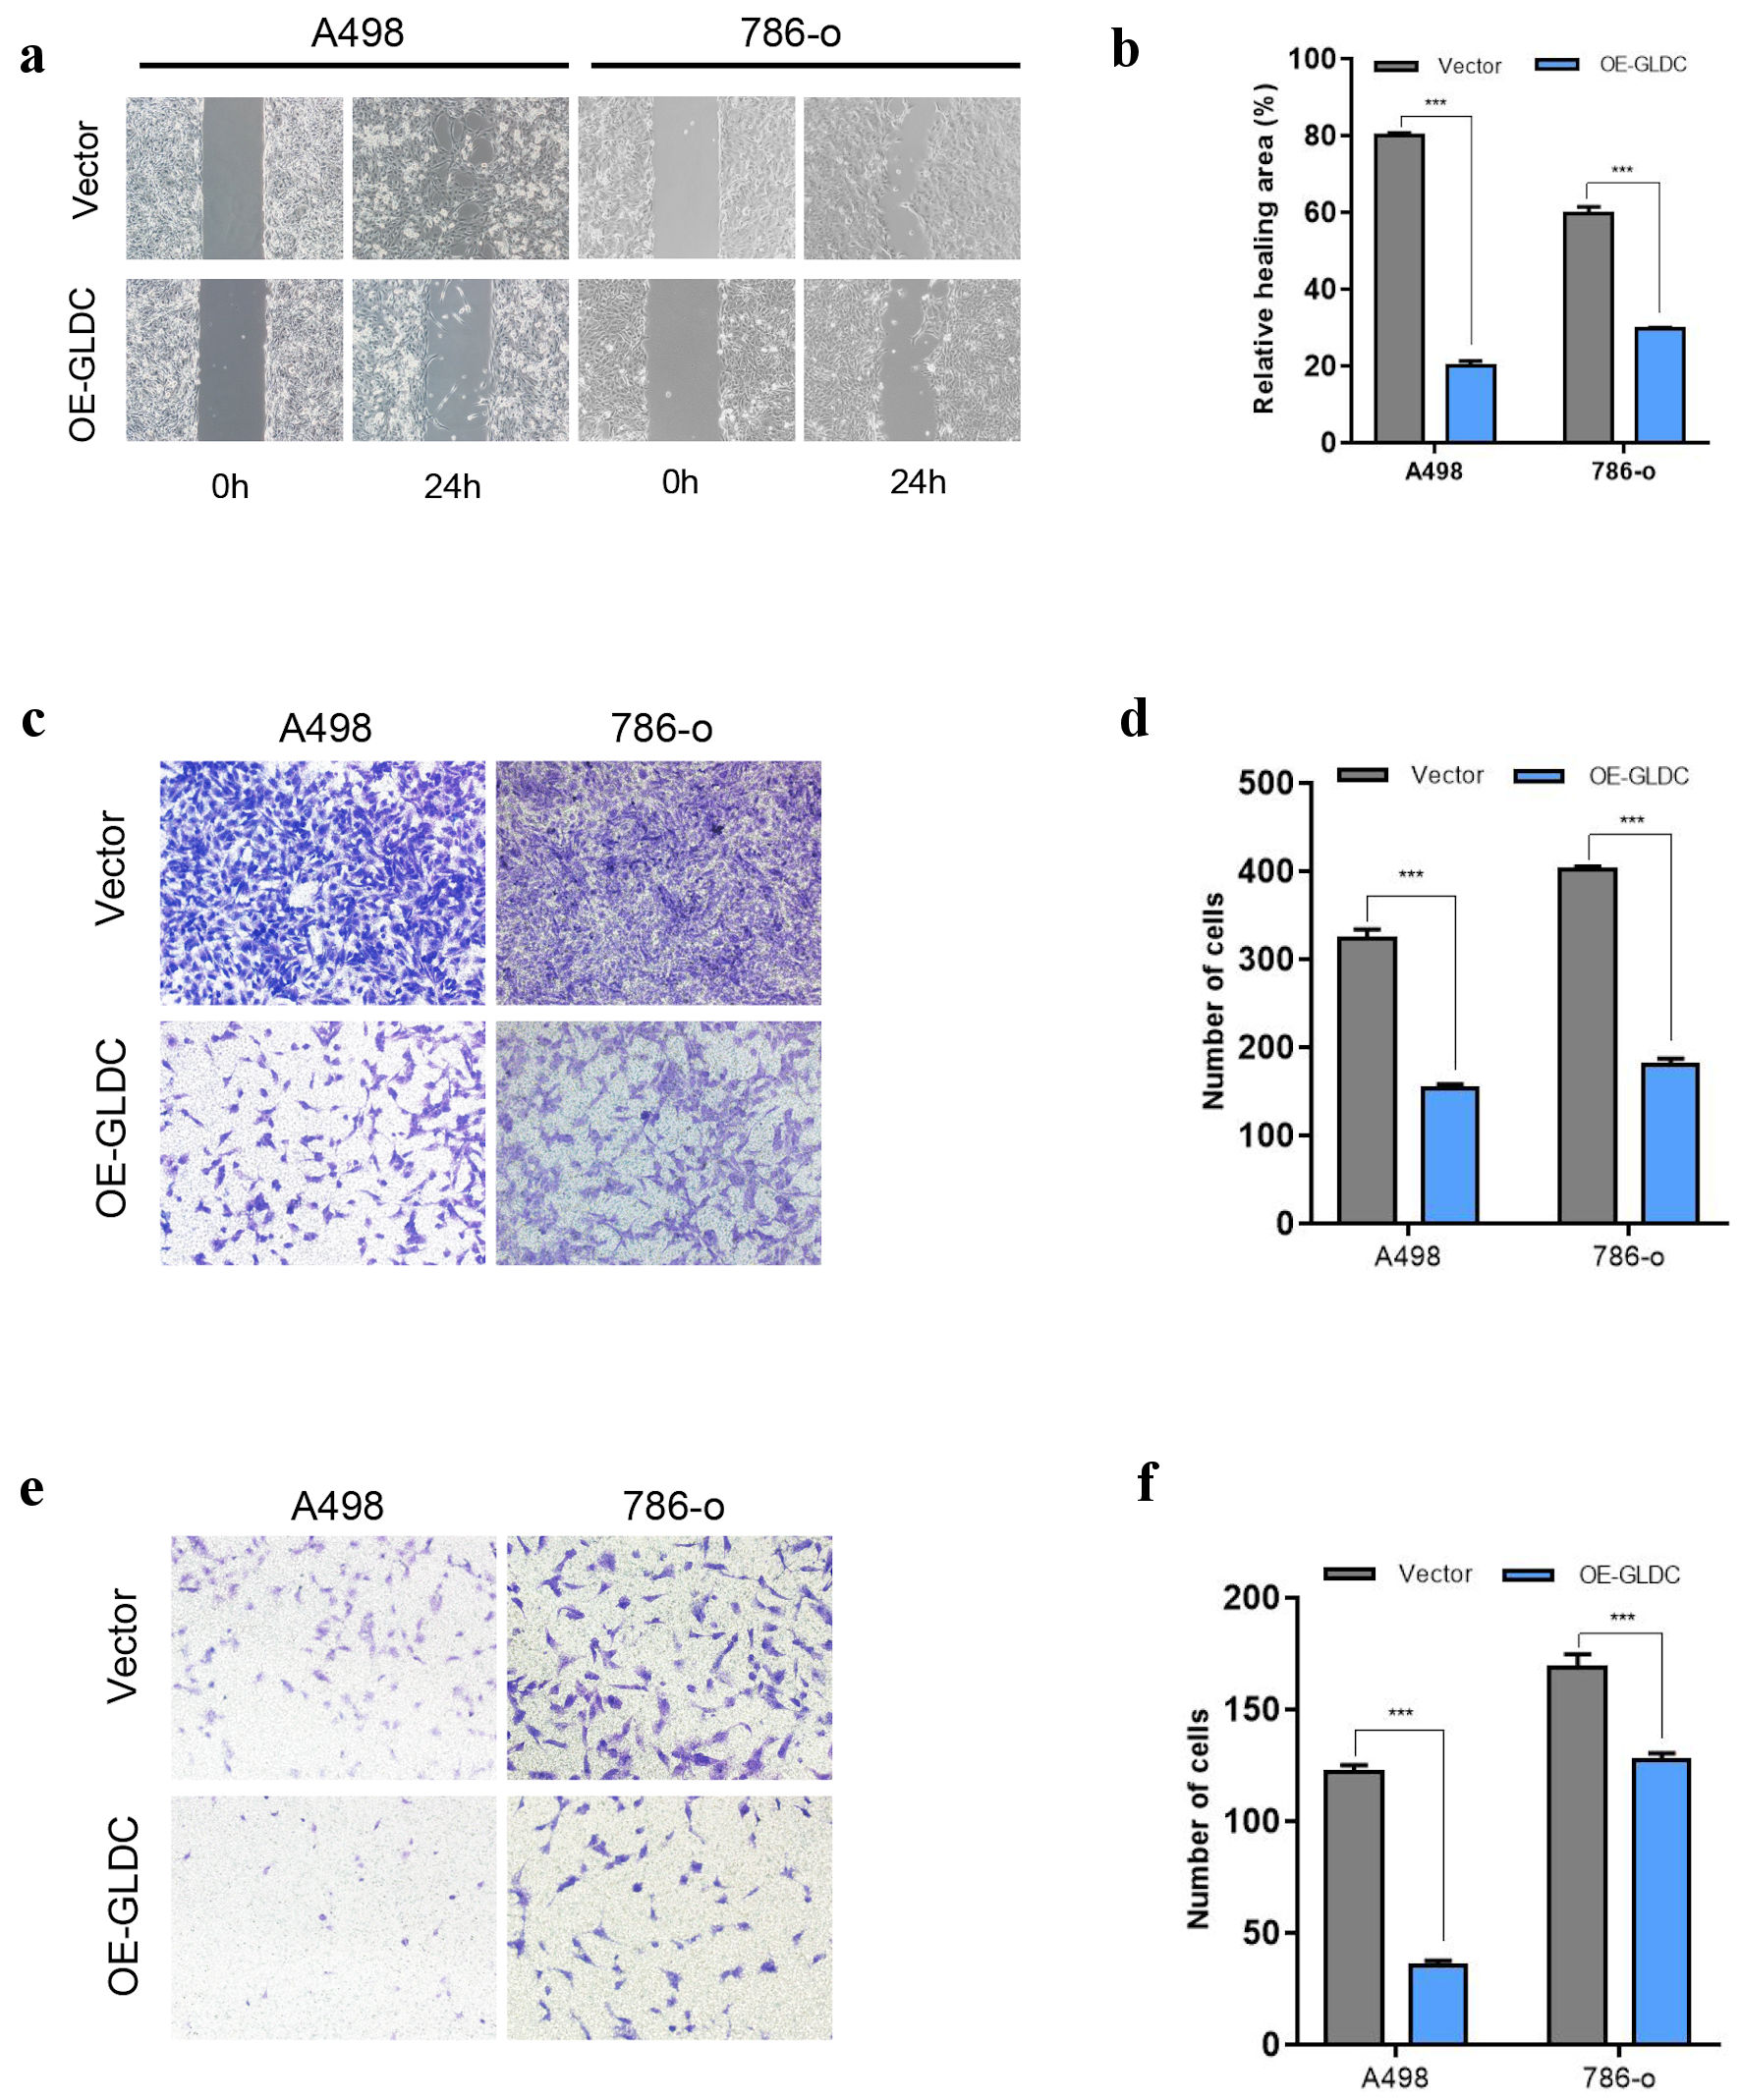 Click for large image | Figure 3. Glycine decarboxylase (GLDC) inhibits the invasion and migration of renal cell carcinoma (RCC) cells. (a) Representative micrographs of the wound healing assay at 0 and 24 h. (b) Quantification of the results shown in (a). (c) Migration examined utilizing the transwell assay. (d) Quantification of the findings indicated in (c). (e) Invasion ability evaluated using the transwell assay. (f) Quantification of the findings presented in (e). *P < 0.05, **P < 0.01, ***P < 0.001. |
Identification of differential proteins
In the protein screening of significant difference, 236 upregulated and 317 downregulated proteins were obtained that had a fold change (FC) of more than 1.2 (upregulated by more than 1.2 or downregulated by less than 0.83), and P < 0.05 as the standard. We list the top 20 upregulated and downregulated proteins in Table 1.
 Click to view | Table 1. Upregulated/Downregulated Differential Proteins (Top 20) |
Volcano
The volcano plot of proteins in the comparison group was created using two criteria: P value and fold change, for demonstrating the substantial disparities in proteins amongst comparison groups. Proteins with significant downregulation were depicted in blue (P < 0.05 and FC < 0.83), proteins considerably upregulated were depicted in red (P < 0.05 and FC > 1.2), and proteins with no significant difference were highlighted in grey, which is illustrated in Figure 4a.
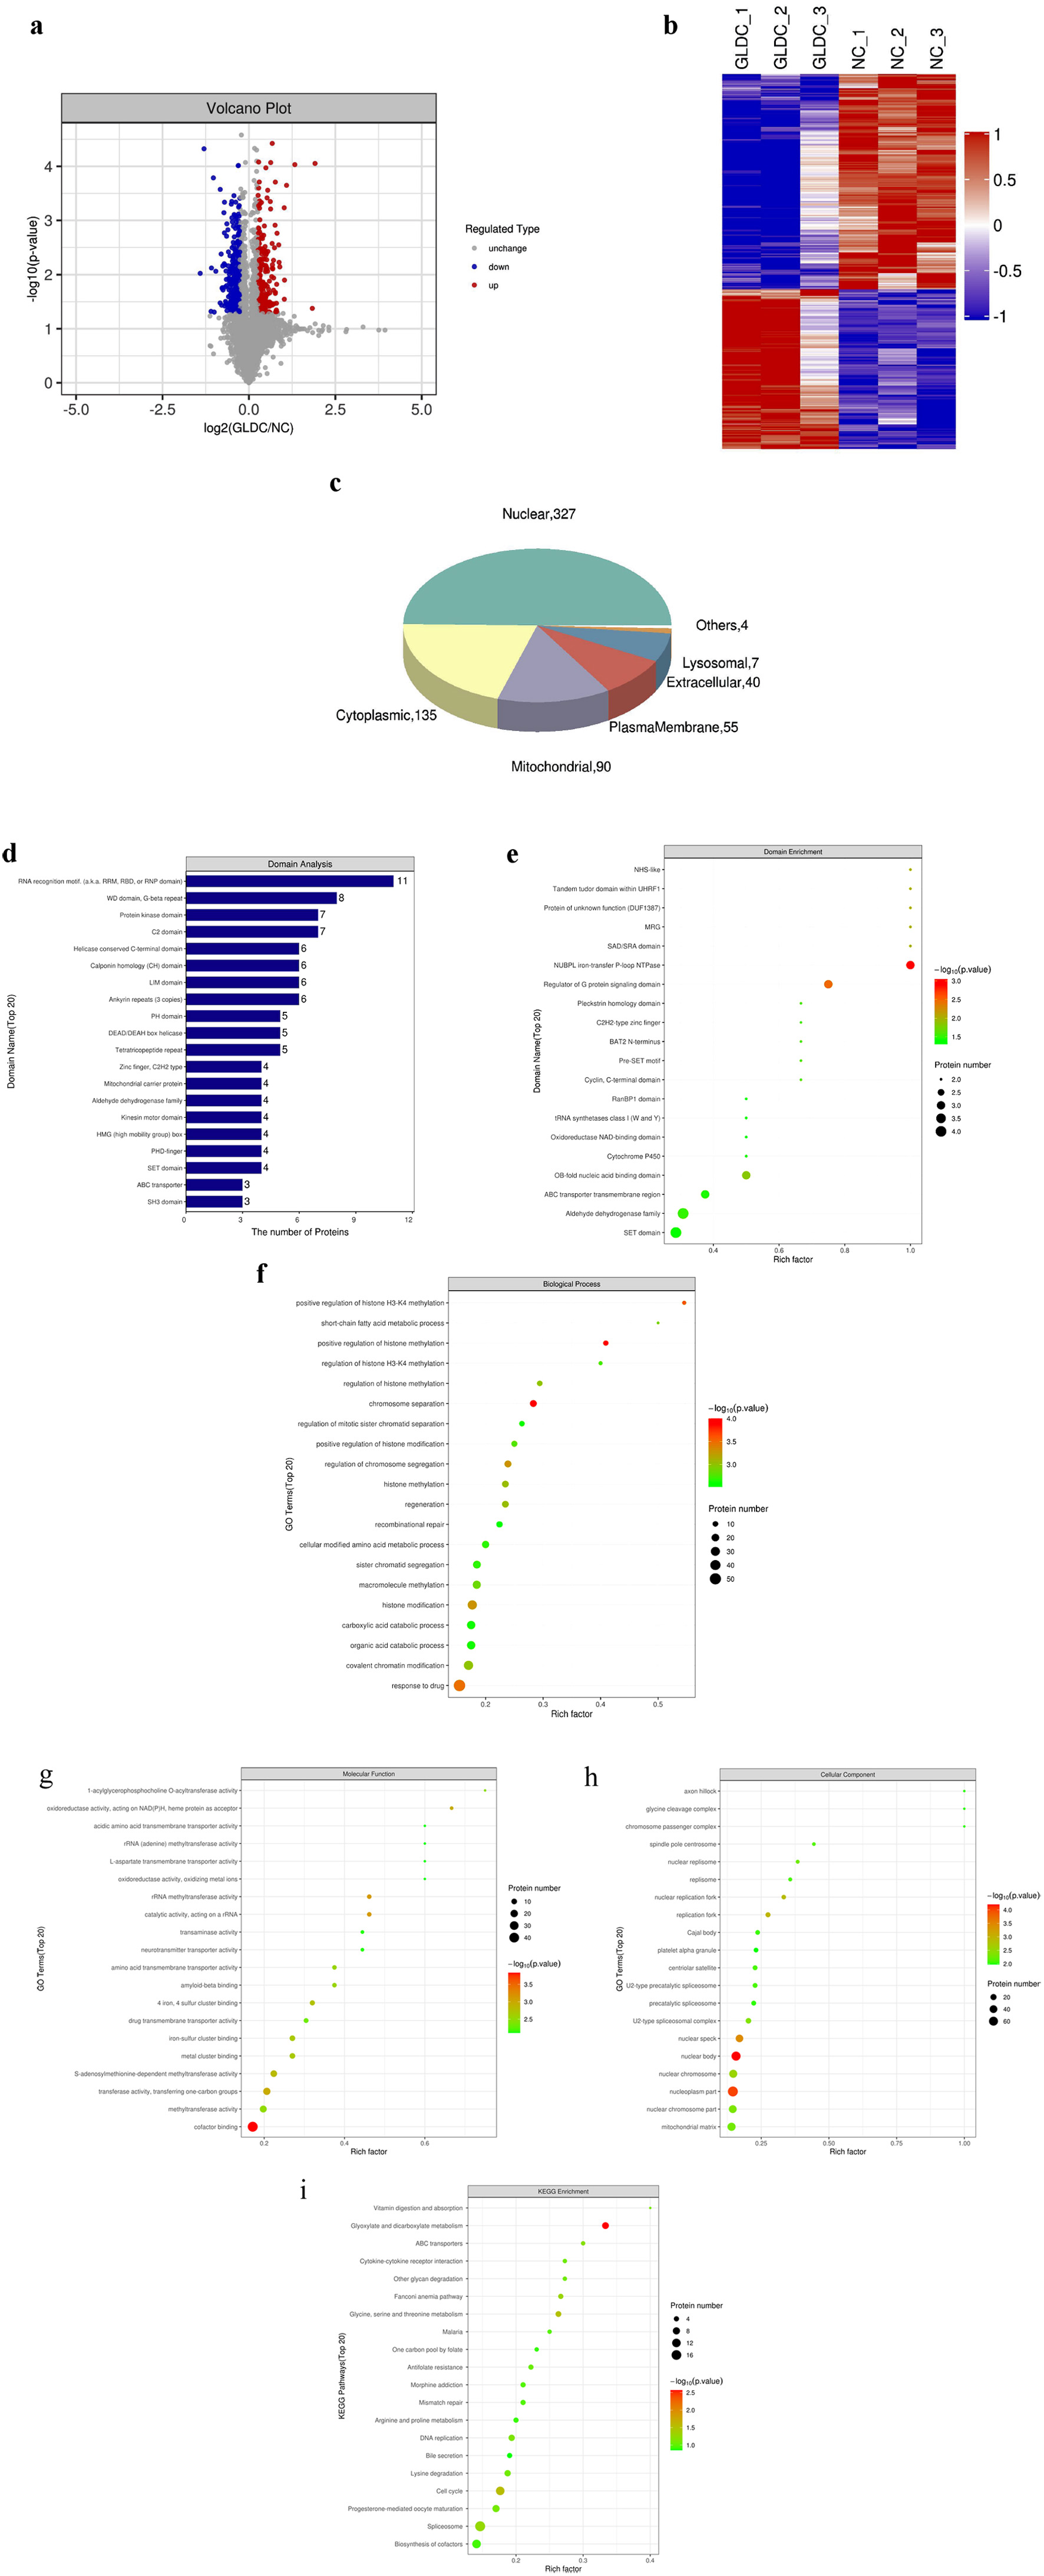 Click for large image | Figure 4. Bioinformatic analysis of differentially expressed genes. (a) Volcano plot. (b) Cluster analysis results of differentially expressed proteins. (c) Pie chart of differential expression of protein subcellular localization. (d) Analysis of differentially expressed protein domains. (e) Analysis map of domain enrichment. (f) Gene Ontology (GO) function enrichment under biological process (BP) classification. (g) Function enrichment bubble diagram under molecular function (MF) classification. (h) Cellular component (CC) of GO function enrichment. (i) Enrichment bubble diagram of Kyoto Encyclopedia of Genes and Genomes (KEGG) pathways. |
Cluster analysis
According to the screening standards of P less than 0.05 and FC greater than 1.2-fold, substantially differentially expressed proteins acquired could successfully differentiate the comparison group, pointing out that differential expression protein screening can reflect the impact of biological treatments on the sample, as shown in Figure 4b.
Subcellular localization analysis
Differentially expressed proteins’ subcellular localization was examined using the subcellular structure prediction software CELLO. Differential proteins are mainly distributed in the nucleus (327), cytoplasm (135), mitochondria (90), plasma membrane (55), extracellular matrix (40) and lysosome (7) (Fig. 4c).
Domain analysis
The domain prediction program known as InterProScan was used to make predictions about the domains of the proteins whose expression levels varied. The number of proteins in each domain (top 20) is displayed in the form of a histogram (Fig. 4d, e).
GO function analysis
All differentially expressed proteins were examined according to the GO function annotation results to reveal functional categories (P < 0.05). A bubble diagram was utilized to illustrate the enrichment of GO terms within the three categories listed below: biological process, cellular components, and molecular function. As shown in Figure 4f, important biological processes have undergone significant changes, such as “positive regulation of histone H3-K4 methylation”, “chromatin separation”, “response to drugs”, “regulation of chromosome segregation”, and “positive regulation of histone methylation”. As shown in Figure 4g, molecular functions include significant changes such as “cofactor binding”, “rRNA methyltransferase activity”, “catalytic activity, acting on a rRNA”, “transferase activity, transferring one-carbon groups”, “oxidoreductase activity, acting on NAD(P)H, heme protein as acceptor”. Finally, as shown in Figure 4h, cellular components have undergone significant changes, such as “nuclear body”, “nucleoplasm part”, “nuclear speck”, “replication fork”, and “nuclear replication fork”.
KEGG pathway analysis
All the differentially expressed proteins were compared through KEGG annotation results to reveal the pathway categories involved (P < 0.05). As shown in Figure 4i, key pathways such as “cell cycle”, “glyoxylate and dicarboxylate metabolism”, and “threonine, glycine, and serine metabolism” have all undergone considerable alterations.
Analysis of the PPI network
Cytoscape was used to generate the PPI network diagram, which was based on the PPI included in the STRING database. Figure 5a shows the interactions of proteins differentially expressed among the comparison groups. In PPI networks, highly aggregated proteins may have the same or similar functions and play biological functions through synergistic action. Therefore, based on the principle of topological structure recognition, the proteins with high aggregation degree in the interaction network are divided into different clusters (Fig. 5b-g). The interacting proteins (top 10) are listed in Table 2.
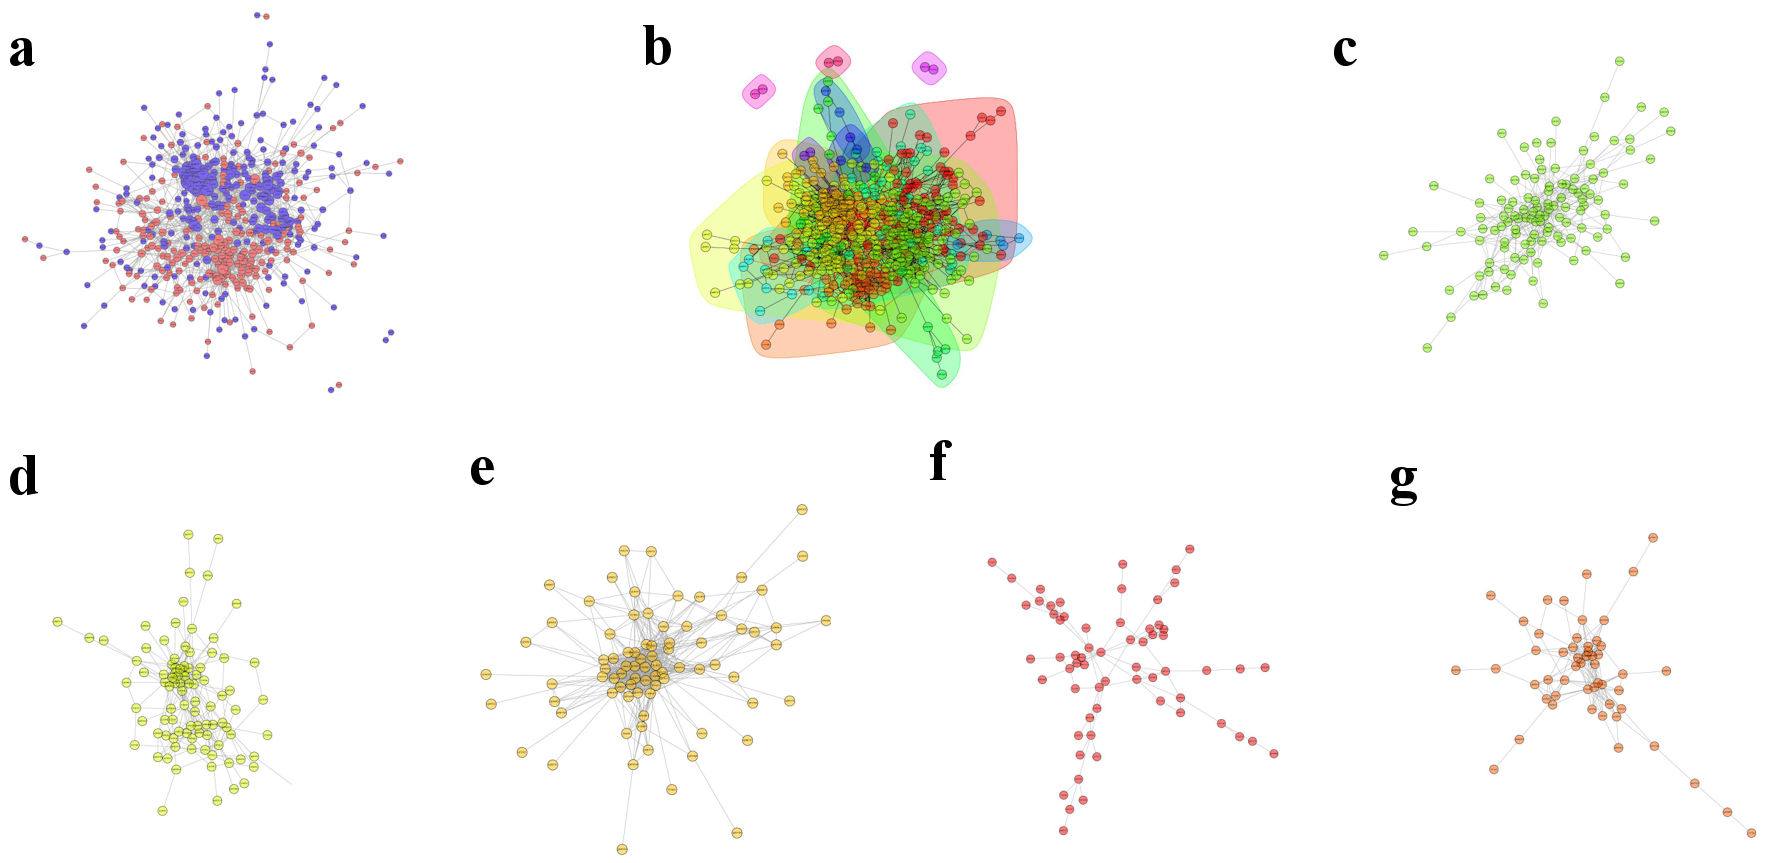 Click for large image | Figure 5. Protein-protein interaction network. (a) Diagram of differential expression of the protein-protein interaction network. (b) Interaction network for functional classification. (c) Cluster 1. (d) Cluster 2. (e) Cluster 3. (f) Cluster 4. (g) Cluster 5. |
Click to view | Table 2. The Interacting Proteins (Top 10) in PPI Network in Different Clusters |
| Discussion | ▴Top |
In this study, we examined the functions of GLDC in RCC. We discovered that GLDC can greatly reduce the ability of RCC cells to invade, proliferate, and migrate. TMT analysis of renal cells showed that the A498 cell line overexpressing GLDC had 236 upregulated and 317 downregulated genes. Bioinformatic analysis of these genes indicated that they were part of various biological processes in the cells. These results indicate that inhibiting the progression of RCC could be accomplished by targeting GLDC.
The energy required for normal cell metabolism is primarily obtained from adenosine triphosphate (ATP) produced by oxidative phosphorylation in the mitochondria [11, 12], while tumor cells with high proliferation capacity prefer the glycolysis pathway with low productivity efficiency for energy supply [13-15]. Therefore, abnormal metabolic capacity has become one of the main characteristics of tumors [16]. Tumor cells synthesize intermediate metabolites through pentose phosphate, amino acid, and lipid synthesis to meet the glycolysis requirements of tumor cells, subsequently performing vigorous biosynthetic metabolism to provide protein, fat, and nucleic acids for tumor growth [17]. Abnormal metabolism in the tumor microenvironment (TME) is important for tumor growth [18, 19]. Metabolism in the TME involves glucose, pyruvate, lactic acid, amino acid, and lipid metabolism. Tumor cells efficiently use intermediate metabolites in the microenvironment to achieve rapid tumor cell growth and metastasis [20, 21].
Enzymes that metabolize amino acids play a significant part in the genesis and progression of malignancies [8, 22-24]. These enzymes are also intimately connected to the biological processes that are characteristic of cancer cells, such as proliferation, apoptosis, invasion, metastasis, and treatment resistance [25-28]. Among these, GLDC is one of the core metabolic enzymes regulating glycine metabolism. GLDC is substantially expressed in non-small cell lung cancer (NSCLC) stem cells and may increase the tumorigenicity of these cells by boosting glycolysis and pyrimidine metabolism. GLDC is also strongly expressed in NSCLC tumors [29].
GLDC mainly exists in the mitochondria and catalyzes the oxidative decarboxylation and deamination of glycine, thereby removing CO2 and NH3 [8]. Glycine is metabolized to tetrahydrofolate and NADH to generate serine. These molecules are intermediates in the typical metabolic process. Simultaneously, GLDC can also catalyze the reverse reaction, i.e., the conversion of serine to glycine that is dependent on folate ester. Accordingly, GLDC is primarily involved in the cellular metabolism of amino acids and affects glycolysis, pyrimidine synthesis, and other metabolic pathways [30, 31]. The biological functions of GLDC in organisms are mostly related to processes of amino acid metabolism, such as protein composition, as well as the basic structure of several important substances, including methionine, choline, some important hormones, and deoxyribonucleic acid [32, 33]. Recent studies have shown that abnormal metabolism of glutamine, serine, aspartic acid, glycine, and other amino acids is closely associated with tumor growth, invasion, and metastasis [34]. Tumor cells use these amino acids to maintain rapid growth and expansion. Therefore, it is difficult for tumor cells to block the metabolism of amino acids. Recent studies have shown that GLDC can metabolize glycine into cell growth intermediates. In the absence of GLDC, glycine enters a different metabolic signaling pathway and generates toxic products. These toxic metabolites accumulate in tumor cells and induce tumor cell death. Blocking this enzyme in glioblastoma may provide a new strategy to combat this type of tumor [28]. The intracellular glycine metabolism is a complex regulatory network. Currently, reports on the inhibition of growth, invasion, and metastasis of RCC are lacking. The network of GLDC regulatory genes and biological processes involved remain unknown. Research has to be done to determine whether or not GLDC and its gene regulation network play significant roles in the incidence of RCC and its progression. In-depth research on the molecular mechanisms may provide new ideas for RCC treatment.
In order to further explore the molecular mechanism of GLDC, we overexpressed GLDC and detected the differentially expressed genes by mass spectrometer, so we obtained 317 downregulated genes and 236 upregulated genes (the protein of top 20 is listed in Table 1). These differentially expressed genes may be related to this pathway: from the abnormality of GLDC to the pathogenesis of RCC. Next, we use bioinformatics methods to study the functions of these genes. We use the volcano plot to visually display these genes. The results of cluster analysis show that the grouping of these differential proteins is representative, and the analysis results are very reliable. In order to understand the distribution of these differential proteins in cells, we performed subcellular localization analysis of them with CELLO software. The results showed that they were mainly distributed in the nucleus (327), cytoplasm (135), mitochondria (90), plasma membrane (55), cellular matrix (40) and lysome (7), the most of which are distributed in the nucleus, also indicate that they may exercise their functions in the nucleus, thus affecting the transcription function. We used InterProScan software to predict the structural thresholds of differential proteins and found that their structural thresholds were mainly concentrated in “RNA recognition motif” and “NUBPL iron-transfer P-loop NTPase”. GO functional analysis showed that these differential proteins are mainly concentrated in “positive regulation of histone H3-K4 methylation”, “cofactor binding”, and “nuclear body”, which also indicates that they have influence on these functions. KEGG pathway analysis showed that these differential proteins were mainly concentrated in some important signaling pathways, including “cell cycle”, “glyoxylate and dicarboxylate metabolism”, and “threonine, glycine, and serine metabolism”. Finally, we performed protein interaction network analysis and obtained five highly aggregated protein network clusters. The proteins in each cluster have the same or similar functions, and these proteins are listed in Table 2.
Our study revealed that GLDC is expressed at low levels in tumor tissues of patients with RCC and relevant cell lines. CCK8 and EdU experiments showed that GLDC overexpression inhibited RCC cell proliferation. Scratch and transwell assays demonstrated that GLDC overexpression could inhibit the invasion and metastasis of RCC cells. In order to investigate GLDC’s influence on the expression of other genes more thoroughly, we overexpressed GLDC in A498 cells, detected differentially expressed genes, and analyzed the biological processes of these genes. We found that GLDC overexpression altered some signaling pathways, such as dicarboxylate and glyoxylate metabolism, cell cycle, and glycine, threonine, and serine metabolism.
However, this study has some limitations. First, only A498 cell lines were used for TMT detection in this study and using additional cell lines could have provided robust evidence. Second, the mechanisms through which other genes mediate GLDC and tumorigenesis need to be explored.
Conclusions
In summary, this study revealed that overexpression of GLDC can inhibit the malignant progression of RCC, and overexpression of GLDC alters the expression of several genes and abnormal biological processes. Therefore, GLDC has the potential to be a novel and valuable oncotarget protein in human kidney cancer.
Acknowledgments
We are thankful to all patients for providing samples.
Financial Disclosure
This work was supported by the Shenzhen Science and Technology Program (Basic Research Project; No. JCYJ20210324125010029), the Longhua Science and Technology Innovation Fund (No. LHKJCXJCYJ202002), the Medical Key Discipline of Longhua District (No. MKD202007090201), the National Natural Science Foundation of China (No. 82103876), China Postdoctoral Science Foundation (No. 2022M713281).
Conflict of Interest
The authors declare no conflict of interest.
Informed Consent
Informed consent was obtained from all subjects involved in the study.
Author Contributions
Conceptualization, YDC and KXG. Methodology: YDC, KXG, ZW, QD and YTC. Software: YDC. Investigation: YDC and KXG. Resources: HL, ZW, QD. Writing-original draft preparation: YDC. Writing-review and editing: YDC, KXG, ZW, QD, YTC and HL. Project administration: YTC, HL. All authors have read and agreed to the published version of the manuscript.
Data Availability
All the relevant data generated during this study are included in the manuscript. Further inquiries can be directed to the corresponding author.
| References | ▴Top |
- Siegel RL, Miller KD, Fuchs HE, Jemal A. Cancer statistics, 2021. CA Cancer J Clin. 2021;71(1):7-33.
doi pubmed - Bahadoram S, Davoodi M, Hassanzadeh S, Bahadoram M, Barahman M, Mafakher L. Renal cell car-cinoma: an overview of the epidemiology, diagnosis, and treatment. G Ital Nefrol. 2022;39(3):1-16.
- D'Avella C, Abbosh P, Pal SK, Geynisman DM. Mutations in renal cell carcinoma. Urol Oncol. 2020;38(10):763-773.
doi pubmed - Dell'Atti L, Bianchi N, Aguiari G. New therapeutic interventions for kidney carcinoma: looking to the future. Cancers (Basel). 2022;14(15):3616-3629.
doi pubmed - Mao W, Wang K, Wu Z, Xu B, Chen M. Current status of research on exosomes in general, and for the diagnosis and treatment of kidney cancer in particular. J Exp Clin Cancer Res. 2021;40(1):305.
doi pubmed - Qi X, Li Q, Che X, Wang Q, Wu G. The uniqueness of clear cell renal cell carcinoma: summary of the process and abnormality of glucose metabolism and lipid metabolism in ccRCC. Front Oncol. 2021;11:727778.
doi pubmed - Ren J, Wang W, Nie J, Yuan W, Zeng AP. Understanding and engineering glycine cleavage system and related metabolic pathways for C1-based biosynthesis. Adv Biochem Eng Biotechnol. 2022;180:273-298.
doi pubmed - Go MK, Zhang WC, Lim B, Yew WS. Glycine decarboxylase is an unusual amino acid decarboxylase involved in tumorigenesis. Biochemistry. 2014;53(5):947-956.
doi pubmed - Jager K, Larribere L, Wu H, Weiss C, Gebhardt C, Utikal J. Expression of neural crest markers GLDC and ERRFI1 is correlated with melanoma prognosis. Cancers (Basel). 2019;11(1):76.
doi pubmed - Min HL, Kim J, Kim WH, Jang BG, Kim MA. Epigenetic silencing of the putative tumor suppressor gene GLDC (Glycine Dehydrogenase) in gastric carcinoma. Anticancer Res. 2016;36(1):179-187.
- Wilson DF. Oxidative phosphorylation: regulation and role in cellular and tissue metabolism. J Physiol. 2017;595(23):7023-7038.
doi pubmed - Cargill K, Sims-Lucas S. Metabolic requirements of the nephron. Pediatr Nephrol. 2020;35(1):1-8.
doi pubmed - Jin M, Cao W, Chen B, Xiong M, Cao G. Tumor-derived lactate creates a favorable niche for tumor via supplying energy source for tumor and modulating the tumor microenvironment. Front Cell Dev Biol. 2022;10:808859.
doi pubmed - Abdel-Wahab AF, Mahmoud W, Al-Harizy RM. Targeting glucose metabolism to suppress cancer pro-gression: prospective of anti-glycolytic cancer therapy. Pharmacol Res. 2019;150:104511.
doi pubmed - Talekar M, Boreddy SR, Singh A, Amiji M. Tumor aerobic glycolysis: new insights into therapeutic strategies with targeted delivery. Expert Opin Biol Ther. 2014;14(8):1145-1159.
doi pubmed - Kennedy KM, Dewhirst MW. Tumor metabolism of lactate: the influence and therapeutic potential for MCT and CD147 regulation. Future Oncol. 2010;6(1):127-148.
doi pubmed - Hanahan D, Weinberg RA. Hallmarks of cancer: the next generation. Cell. 2011;144(5):646-674.
doi pubmed - Khalaf K, Hana D, Chou JT, Singh C, Mackiewicz A, Kaczmarek M. Aspects of the tumor microenvi-ronment involved in immune resistance and drug resistance. Front Immunol. 2021;12:656364.
doi pubmed - Siemann DW, Horsman MR. Modulation of the tumor vasculature and oxygenation to improve therapy. Pharmacol Ther. 2015;153:107-124.
doi pubmed - Kroemer G, Pouyssegur J. Tumor cell metabolism: cancer's Achilles' heel. Cancer Cell. 2008;13(6):472-482.
doi pubmed - Zhao D, Li FL, Cheng ZL, Lei QY. Impact of acetylation on tumor metabolism. Mol Cell Oncol. 2014;1(3):e963452.
doi pubmed - Zhuang H, Wu F, Wei W, Dang Y, Yang B, Ma X, Han F, et al. Glycine decarboxylase induces au-tophagy and is downregulated by miRNA-30d-5p in hepatocellular carcinoma. Cell Death Dis. 2019;10(3):192.
doi pubmed - Zhuang H, Li Q, Zhang X, Ma X, Wang Z, Liu Y, Yi X, et al. Downregulation of glycine decarboxylase enhanced cofilin-mediated migration in hepatocellular carcinoma cells. Free Radic Biol Med. 2018;120:1-12.
doi pubmed - Alptekin A, Ye B, Yu Y, Poole CJ, van Riggelen J, Zha Y, Ding HF. Glycine decarboxylase is a tran-scriptional target of MYCN required for neuroblastoma cell proliferation and tumorigenicity. Oncogene. 2019;38(50):7504-7520.
doi pubmed - Woo CC, Kaur K, Chan WX, Teo XQ, Lee THP. Inhibiting glycine decarboxylase suppresses py-ruvate-to-lactate metabolism in lung cancer cells. Front Oncol. 2018;8:196.
doi pubmed - Jiang P, Du W, Wang X, Mancuso A, Gao X, Wu M, Yang X. p53 regulates biosynthesis through direct inactivation of glucose-6-phosphate dehydrogenase. Nat Cell Biol. 2011;13(3):310-316.
doi pubmed - Amelio I, Cutruzzola F, Antonov A, Agostini M, Melino G. Serine and glycine metabolism in cancer. Trends Biochem Sci. 2014;39(4):191-198.
doi pubmed - Kim D, Fiske BP, Birsoy K, Freinkman E, Kami K, Possemato RL, Chudnovsky Y, et al. SHMT2 drives glioma cell survival in ischaemia but imposes a dependence on glycine clearance. Nature. 2015;520(7547):363-367.
doi pubmed - Zhang WC, Shyh-Chang N, Yang H, Rai A, Umashankar S, Ma S, Soh BS, et al. Glycine decarboxylase activity drives non-small cell lung cancer tumor-initiating cells and tumorigenesis. Cell. 2012;148(1-2):259-272.
doi pubmed - Mukha D, Fokra M, Feldman A, Sarvin B, Sarvin N, Nevo-Dinur K, Besser E, et al. Glycine decarbox-ylase maintains mitochondrial protein lipoylation to support tumor growth. Cell Metab. 2022;34(5):775-782.e779.
doi pubmed - O'Reilly J, Pangilinan F, Hokamp K, Ueland PM, Brosnan JT, Brosnan ME, Brody LC, et al. The impact of common genetic variants in the mitochondrial glycine cleavage system on relevant metabolites. Mol Genet Metab Rep. 2018;16:20-22.
doi pubmed - Sun WY, Kim HM, Jung WH, Koo JS. Expression of serine/glycine metabolism-related proteins is dif-ferent according to the thyroid cancer subtype. J Transl Med. 2016;14(1):168.
doi pubmed - Kang PJ, Zheng J, Lee G, Son D, Kim IY, Song G, Park G, et al. Glycine decarboxylase regulates the maintenance and induction of pluripotency via metabolic control. Metab Eng. 2019;53:35-47.
doi pubmed - Hensley CT, Wasti AT, DeBerardinis RJ. Glutamine and cancer: cell biology, physiology, and clinical opportunities. J Clin Invest. 2013;123(9):3678-3684.
doi pubmed
This article is distributed under the terms of the Creative Commons Attribution Non-Commercial 4.0 International License, which permits unrestricted non-commercial use, distribution, and reproduction in any medium, provided the original work is properly cited.
World Journal of Oncology is published by Elmer Press Inc.