

| World Journal of Oncology, ISSN 1920-4531 print, 1920-454X online, Open Access |
| Article copyright, the authors; Journal compilation copyright, World J Oncol and Elmer Press Inc |
| Journal website https://www.wjon.org |
Original Article
Volume 15, Number 2, April 2024, pages 209-222

DNA Damage-Induced Apoptosis Suppressor Triggers Progression and Stemness of Glioma by Enhancing Lymphoid Enhancer-Binding Factor 1 Expression
You Lin Chena, e, Yi Liub, e, Yan Xuc, An Qiang Yanga, Gui Jie Chena, Jin Shan Xingb, Hong Wei Sud, Li Shang Liaob, f
aDepartment of Neurosurgery, the First People’s Hospital of Yibin, Yibin, Sichuan 644000, China
bDepartment of Neurosurgery, the Affiliated Traditional Chinese Medicine Hospital of Southwest Medical University, Luzhou, Sichuan 646099, China
cDepartment of Anesthesia and Surgery, the First People’s Hospital of Yibin, Yibin, Sichuan 644000, China
dDepartment of Urology, the Affiliated Traditional Chinese Medicine Hospital of Southwest Medical University, Luzhou, Sichuan 646099, China
eThese authors contributed equally to this work.
fCorresponding Author: Li Shang Liao, Department of Neurosurgery, the Affiliated Traditional Chinese Medicine Hospital of Southwest Medical University, Luzhou, Sichuan 646099, China
Manuscript submitted November 1, 2023, accepted February 21, 2024, published online March 21, 2024
Short title: DDIAS Induces Glioma Progression and Stemness
doi: https://doi.org/10.14740/wjon1754
| Abstract | ▴Top |
Background: DNA damage-induced apoptosis suppressor (DDIAS) has recently been discovered to induce cancer progression, but its functions and mechanisms in glioma have not been well studied.
Methods: DDIAS expression in glioma tissues was analyzed by the Gene Expression Profiling Interactive Analysis server (GEPIA) and the Gene Expression database of Normal and Tumor tissue 2 (GENT2) databases. The role of DDIAS in glioma progression was studied by short hairpin RNA (shRNA) targeting DDIAS. The effects of DDIAS on glioma cell viability, cell proliferation, invasion, migration, and tumor sphere formation were determined by cell counting kit-8 (CCK-8), EdU, Transwell, tumor spheroid formation, extreme limiting dilution analysis assays in vitro and xenograft model construction in vivo. In addition, RNA sequencing and further functional experiments were used to analyze the DDIAS regulatory mechanism in glioma.
Results: We found that DDIAS was highly expressed in glioma and that upregulated DDIAS indicated poor prognosis. Functionally, DDIAS knockdown inhibited glioma cell viability, cell proliferation, invasion and migration in vitro and tumor growth in vivo. In addition, lymphoid enhancer-binding factor 1 (LEF1) was identified as the downstream effector of DDIAS by RNA sequencing. DDIAS downregulation inhibited LEF1 mRNA and protein expression. The expression of DDIAS and LEF1 was positively correlated, and LEF1 overexpression rescued the inhibitory phenotype induced by DDIAS downregulation. We further showed that DDIAS downregulation inhibited cyclin A1, vimentin and the stemness-related factor CD133 and decreased the sphere formation capability, but these features were rescued by upregulation of LEF1.
Conclusion: Taken together, these findings suggest that DDIAS promotes glioma progression and stemness by inducing LEF1 expression, proving that DDIAS may be a potential target for the treatment of glioma.
Keywords: DDIAS; LEF1; Glioma; Cell proliferation; Stemness
| Introduction | ▴Top |
Glioma is the most common malignancy in the central nervous system [1]. Despite advances in early detection, neurosurgery and adjuvant therapy, the prognosis of patients with glioma remains poor [2]. Hence, it is imperative to reveal the molecular mechanism and develop new therapeutic strategies for improving cancer treatment.
DNA damage-induced apoptosis suppressor (DDIAS), also called Noxin and chromosome 11 open reading frame 82 (C11orf82), functions as an anti-apoptotic protein whose level is induced in response to stress signals, such as hydrogen peroxide, gamma- and UV irradiation, adriamycin, and cytokines [3]. Recently, DDIAS has drawn more attention for its role in tumorigenesis and cancer progression. Evidence suggests that DDIAS is highly expressed in hepatocellular carcinoma, lung cancer, and breast cancer, and upregulated DDIAS is correlated with poor prognosis in lung cancer and breast cancer [4-6]. In breast cancer, upregulated DDIAS enhances cyclin D1 and cyclin E1 expression, thereby promoting cell growth [4]. In hepatocellular carcinoma, DDIAS promotes cell proliferation, colony formation and migration, and accelerates DNA synthesis and cell cycle progression by interacting with DNA polymerase α [6]. In lung cancer, DDIAS enhanced cell proliferation and invasion by preventing protein tyrosine phosphatase receptor mu (PTPRM)/signal transducer and activator of transcription 3 (STAT3) binding and activating STAT3 Y705 phosphorylation [7]. In addition, DDIAS protects lung cancer cells from DNA-damaging reagents and tumor necrosis factor-related apoptosis-inducing ligand (TRAIL) [8, 9]. Thus, DDIAS may play an oncogenic role in the aforementioned tumors. However, the expression pattern and role of DDIAS in glioma is not well clarified.
In this study, we found that DDIAS expression is significantly upregulated in glioma and that highly upregulated DDIAS is associated with poor prognosis. DDIAS knockdown inhibits glioma cell viability, cell proliferation, invasion, migration, sphere formation capability and stemness. In addition, we demonstrated that DDIAS knockdown repressed glioma progression and stemness by regulating lymphoid enhancer-binding factor-1 (LEF1). Thus, DDIAS may serve as a potential therapeutic target for glioma.
| Materials and Methods | ▴Top |
Bioinformatic analysis
The expression levels of DDIAS and LEF1 in glioma were analyzed by the Gene Expression Profiling Interactive Analysis server (GEPIA) [10, 11] and the Gene Expression database of Normal and Tumor tissue 2 (GENT2) [12, 13]. The correlation between DDIAS and LEF1 expression was analyzed by GEPIA and GENT2 databases. The overall survival of DDIAS was analyzed from the GENT2 database with Kaplan-Meier plots by median cut-off. A meta-survival data of DDIAS were also analyzed from the GENT2 database.
Cell culture
The human glioblastoma (GBM) cell lines U251, U87-MG, A172 and U118 were purchased from Procell (Wuhan, China) and cultured in Dulbecco’s Modified Eagle Medium (DMEM) (Gibco, Grand Island, NY, USA) supplemented with 10% (v/v) fetal bovine serum (FBS; Gibco, USA). All cell lines were incubated in a humidified atmosphere with 5% CO2 at 37 °C.
Short hairpin RNA (shRNA) synthesis and plasmid construction
The shRNA targeting DDIAS was synthesized and cloned into the U6-shRNA-CMV-puromycin vector by Shanghai SunBio Biomedical Technology Co., Ltd. (Shanghai, China). The shRNA sequences were as follows: shRNA negative control (shNC): 5′-CCGGTTCTCCGAACGTGTCACGTTTCAAGAGAACGTGACACGTTCGGAGAATTTTTTG-3; shRNA targeting DDIAS 1 (shDDIAS-1): 5′-CCGGCAGAAGAGATCTGCATGTTCTCGAGAACATGCAGATCTCTTCTGTTTTTTG-3′; shRNA targeting DDIAS 2 (shDDIAS-2): 5′-CCGGGACCATTCTAGTCTAAATACTCGAGTATTTAGACTAGAATGGTC TTTTTTG-3′. The validated shDDIAS-2-resistant mutant form of DDIAS (DDIAS-Mut) that contains several mismatches but synonymous mutations was cloned into the pcDNA3.1 vectors (pcDNA3.1) with neomycin by Shanghai SunBio Biomedical Technology Co., Ltd. (Shanghai, China). The pCMV-N-FLAG vectors with hygromycin for LEF1 overexpression were also constructed by Shanghai SunBio Biomedical Technology Co., Ltd. (Shanghai, China).
Cell transfection
U87-MG and U251 cells were seeded into six-well culture plates and grown until they were 70% confluent. For transfection, 7.5 µL of Lipofectamine 3000 reagent (Invitrogen, Grand Island, NY, USA) was added to a tube named tube 1 with 125 µL Opti-MEM medium, and 5 µL of Lipofectamine 3000 reagent and 2.5 µg DNA were added to a tube named tube 2 with 125 µL Opti-MEM medium. After that, tube 2 was added to tube 1 and mixed. The mixture was added to cells. After transfection for 48 h, the cells were collected for further experiments.
Reverse transcription-quantitative polymerase chain reaction (RT-qPCR)
Total RNA was extracted from U87-MG and U251 cells using RNAiso Plus reagent (TaKaRa, Dalian, China) and quantified with a spectrophotometer. cDNA was synthesized using a Maxima First Strand cDNA Synthesis Kit (Thermo Fisher Scientific, Waltham, MA, USA). qPCR was performed with SYBR Green Master Mix (Thermo Fisher Scientific, USA) on a StepOnePlus Real-Time PCR system (Applied Biosystems). The relative expression of LEF1, cyclin A1, cyclin D1, cyclin E1, E-cadherin, N-cadherin and vimentin mRNA was normalized to β-actin by the 2-ΔΔCq method [14]. The primer sequences are shown in Table 1.
 Click to view | Table 1. Primer Sequences |
Western blotting
U87-MG and U251 cells were lysed in RIPA lysis buffer (Boster Biological Technology, Wuhan, China) containing phosphatase inhibitors for 30 min at 4 °C. The cell lysates were centrifuged at 12,000 × g for 10 min at 4 °C. The concentrations of the total proteins were analyzed by a BCA Protein Quantitative Detection Kit (Servicebio Technology Co., Ltd., Wuhan, China). Protein lysates (30 µg each sample) were separated by SDS-PAGE Gel Preparation Kit (Servicebio Technology Co., Ltd., Wuhan, China) and transferred into PVDF membranes (Boster Biological Technology, Wuhan, China). After blocking by TBST with 5% skimmed milk for 1 h, the membrane was incubated with the following primary antibodies: anti-DDIAS (cat. no. CSB-PA006130; Cusabio Technology LLC, Wuhan, China), anti-β-actin (cat. no. 81115-1-RR; Proteintech Group, Inc., Wuhan, China), anti-vimentin (cat. no. 10366-1-AP; Proteintech Group, Inc.), anti-cyclin A1 (cat. no. CSB-PA001859; Cusabio Technology LLC), anti-CD133 (cat. no. 18495-1-AP; Proteintech Group, Inc.) and anti-LEF1 (cat. no. CSB-PA012856LA01HU; Cusabio Technology LLC). After washing with TBST three times, the membranes were incubated with horseradish peroxidase (HRP)-conjugated Affinipure Goat Anti-Rabbit IgG (H+L) secondary antibody (cat. no. SA00001-2; Proteintech Group, Inc.) at room temperature for 1 h. The bands were visualized using an enhanced chemiluminescence (ECL) Chemiluminescent Substrate Kit (cat. no. 36222ES60; Yeasen Biotechnology Co., Ltd., Shanghai, China), and the gray values of the bands were analyzed and calculated by ImageJ software (version 1.8.0; National Institutes of Health).
Cell counting kit-8 (CCK-8) assay
U87-MG and U251 cells (5 × 10³ cells/well) were seeded into 96-well culture plates, and successively cultured for 0, 24, 48, 72 or 96 h. Ten microliter of CCK-8 solution (Beyotime, Shanghai, China) was added to each well. After 3.5 h of incubation, the absorbance values were measured using a microplate reader (Infinite M1000; TECAN) at a wavelength of 450 nm.
EdU assay
U87-MG and U251 cells (5 × 10⁴ cells/well) were seeded into 24-well culture plates. After incubation for 48 h, the cells were cultured with 50 µM EdU buffer for 2 h at 37 °C. The cells were fixed with 4% formaldehyde for 15 min and permeabilized with 0.3% Triton X-100 for 10 min. After washing with PBS two times, EdU solution with Alexa Fluor 594 (Beyotime, Shanghai, China) was added to each well. Nuclei were stained with DAPI Staining Solution (Beyotime, Shanghai, China). The results were visualized by a fluorescence microscope (IX71; Olympus Microscopes) at a magnification of × 200. The micrographs were analyzed by ImageJ software (version 1.8.0; National Institutes of Health).
Transwell assay
For cell invasion assays, the upper chamber of the Transwell (8-µm pore size; BD Biosciences, USA) was precoated with 50 µL Matrigel (Solarbio Science & Technology Co., Ltd., Beijing, China). U87-MG and U251 cells (5 × 10⁴ cells/well) in 100 µL serum-free medium were seeded onto the upper chamber of the Transwell, and medium supplemented with 10% FBS was added into the bottom chamber. For the migration assay, the Transwell upper chambers (8-µm pore size) were seeded with 5 × 10⁴ cells in 100 µL of serum-free DMEM without Matrigel coating. After incubation for 48 h, the filters were fixed with methanol and stained with 0.1% crystal violet. Images were captured under a microscope (IX71; Olympus Microscopes) at a magnification of × 200, and invaded or migrated cells were counted in five random fields of each chamber. The micrographs were analyzed by ImageJ software (version 1.8.0; National Institutes of Health).
RNA sequencing analysis
To obtain the DDISA stable knockdown U251 cell line, U251 cells (5 × 10⁴ cells/well) were seeded into 24-well culture plates overnight, and treated with puromycin (0.5, 1.0, 2.0, 4.0, 8.0, and 10.0 µg/mL). Change the medium with puromycin every 2 days. Results showed that puromycin at doses of 2.0, 4.0, 8.0, and 10.0 µg/mL can effectively kill non-transfected U251 cells within 5 days, thus puromycin at doses of 2.0 µg/mL was selected to create the stable U251 cell line. U251 cells were transfected with shNC and shDDIAS-2 and subsequently selected in puromycin (2.0 µg/mL) for 2 weeks. RNA sequencing was performed at Personalbio Technology Co., Ltd. (Nanjing, China). Briefly, total RNA was extracted from U251 cells using RNAiso Plus reagent (Takara, China). The integrity and concentration of total RNA were qualified by the Agilent 2100 bioanalyzer and the spectrophotometer (Nano Drop 2000; Thermo Fisher Scientific, Inc., USA). The mRNA was purified and fragmented into 200 - 300 bp, and then reverse-transcribed into cDNA. Library construction and subsequent sequencing were performed on the Illumina HiSeq platform (Illumina, San Diego, CA, USA). The cleaned sequencing reads were then mapped to the reference genome (Homo sapiens. GRCh38) using HISAT2. Differentially expressed genes (DEGs) between shNC and shDDIAS were identified by HTSeq and analyzed by DESeq. Gene ontology (GO) analysis was performed to explore the potential functions of these DEGs with fold change (FC) < -1-fold or > 1-fold. RNA-seq data have been deposited in NCBI Sequence Read Archive (SRA) (SRA Submission: SUB13697984, SRA accessions: SRR25375888-SRR25375893).
Xenograft model construction
BALB/c male nude mice (age, 5 weeks; weight, 17 - 20 g; n = 5) were purchased from the Shanghai Lab. Animal Research Center (Shanghai, China). All mice were raised at 24 °C with 50-60% humidity and free access to food and water in a 12:12 light/dark cycle. The xenograft model of glioma was constructed as described previously [15-17]. U251 cells (5 × 10⁶ cells) transfected with shNC and shDDIAS-2 were injected into the right and left dorsal flanks, respectively. After inoculation, the size of each tumor was measured every 4 days with a micrometer caliper. Tumor volumes were calculated by the following formula: volume = (length × width2)/2. On day 28, all mice were euthanized with CO2 (60% displacement of cage volume/min). The tumors were isolated after the absence of a heartbeat and spontaneous breathing for 15 min and the tumor weight was evaluated. All of the procedures were approved by the Institutional Animal Care Committee of Southwest Medical University (approval No. 20210223-037). This study was conducted in compliance with all the applicable institutional ethical guidelines for the care, welfare and use of animals.
Tumor spheroid formation
Tumor spheroid formation assay was performed as described previously [18-20]. U87-MG and U251 cells (1 × 10⁴ cells/well) were cultured in 96-well plates and then maintained in serum-free DMEM F12 (Gibco, USA) with epidermal growth factor (EGF) (20 ng/mL; Thermo Fisher Scientific, USA), basic fibroblast growth factor (bFGF) (20 ng/mL; Thermo Fisher Scientific, USA), leukemia inhibitory factor (LIF) (10 ng/mL; Thermo Fisher Scientific, USA) and B27 factors (× 50; Thermo Fisher Scientific, USA) for 6 days. The images were captured under an inverted microscope (IX71; Olympus Microscopes).
In vitro limiting dilution assay
As previously described, the in vitro limiting dilution assay was performed [21]. U87-MG and U251 cells were seeded in 96-well plates at a density of 1, 10, 20, 30, 40, or 50 cells/well, 20 wells per each density. The number of wells containing tumor sphere was counted under microscopy after 6 days. The tumor sphere synthesis efficiency was calculated by the extreme limiting dilution analysis [22, 23].
Statistical analysis
Statistical analyses were performed by SPSS 19.0 software (SPSS, Inc., Chicago, IL). Data are presented as the mean ± standard deviation (SD). Student’s t-test or one-way analysis of variance (ANOVA) was used to compare the means of two or multiple groups. The Spearman’s correlation analysis was used to analyze the correlation between the DDIAS and LEF1 gene expression. The difference was regarded as significant when the P value was less than 0.05.
| Results | ▴Top |
DDIAS is significantly upregulated in glioma and is associated with poor prognosis in cancer patients
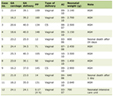
To explore whether the expression level of DDIAS is altered in glioma, we analyzed DDIAS expression by the GEPIA database. The results showed that the level of DDIAS mRNA was significantly upregulated in glioma tissues (Fig. 1a). Results from the GENT2 database showed that the level of DDIAS mRNA was also significantly upregulated in glioma tissues (Fig. 1b). Survival analysis from the GENT2 database showed that glioma patients with higher expression of DDIAS have a shorter survival time (Fig. 1c). To confirm the prognostic relevance of DDIAS mRNA in glioma, a meta-survival analysis was performed by GENT2. We showed that the top four datasets indicate that the hazard ratios (HRs) are over 1 for DDIAS, while the other two datasets show HRs under 1. There was no heterogeneity across the studies (I2 = 0%, P = 0.80), and the fixed effects model was used. Patients with high DDIAS expression in glioma were likely to have a shorter survival time (HR: 1.228, 95% confidence interval (CI): 1.027 - 1.469, P = 0.024) (Fig. 1d).
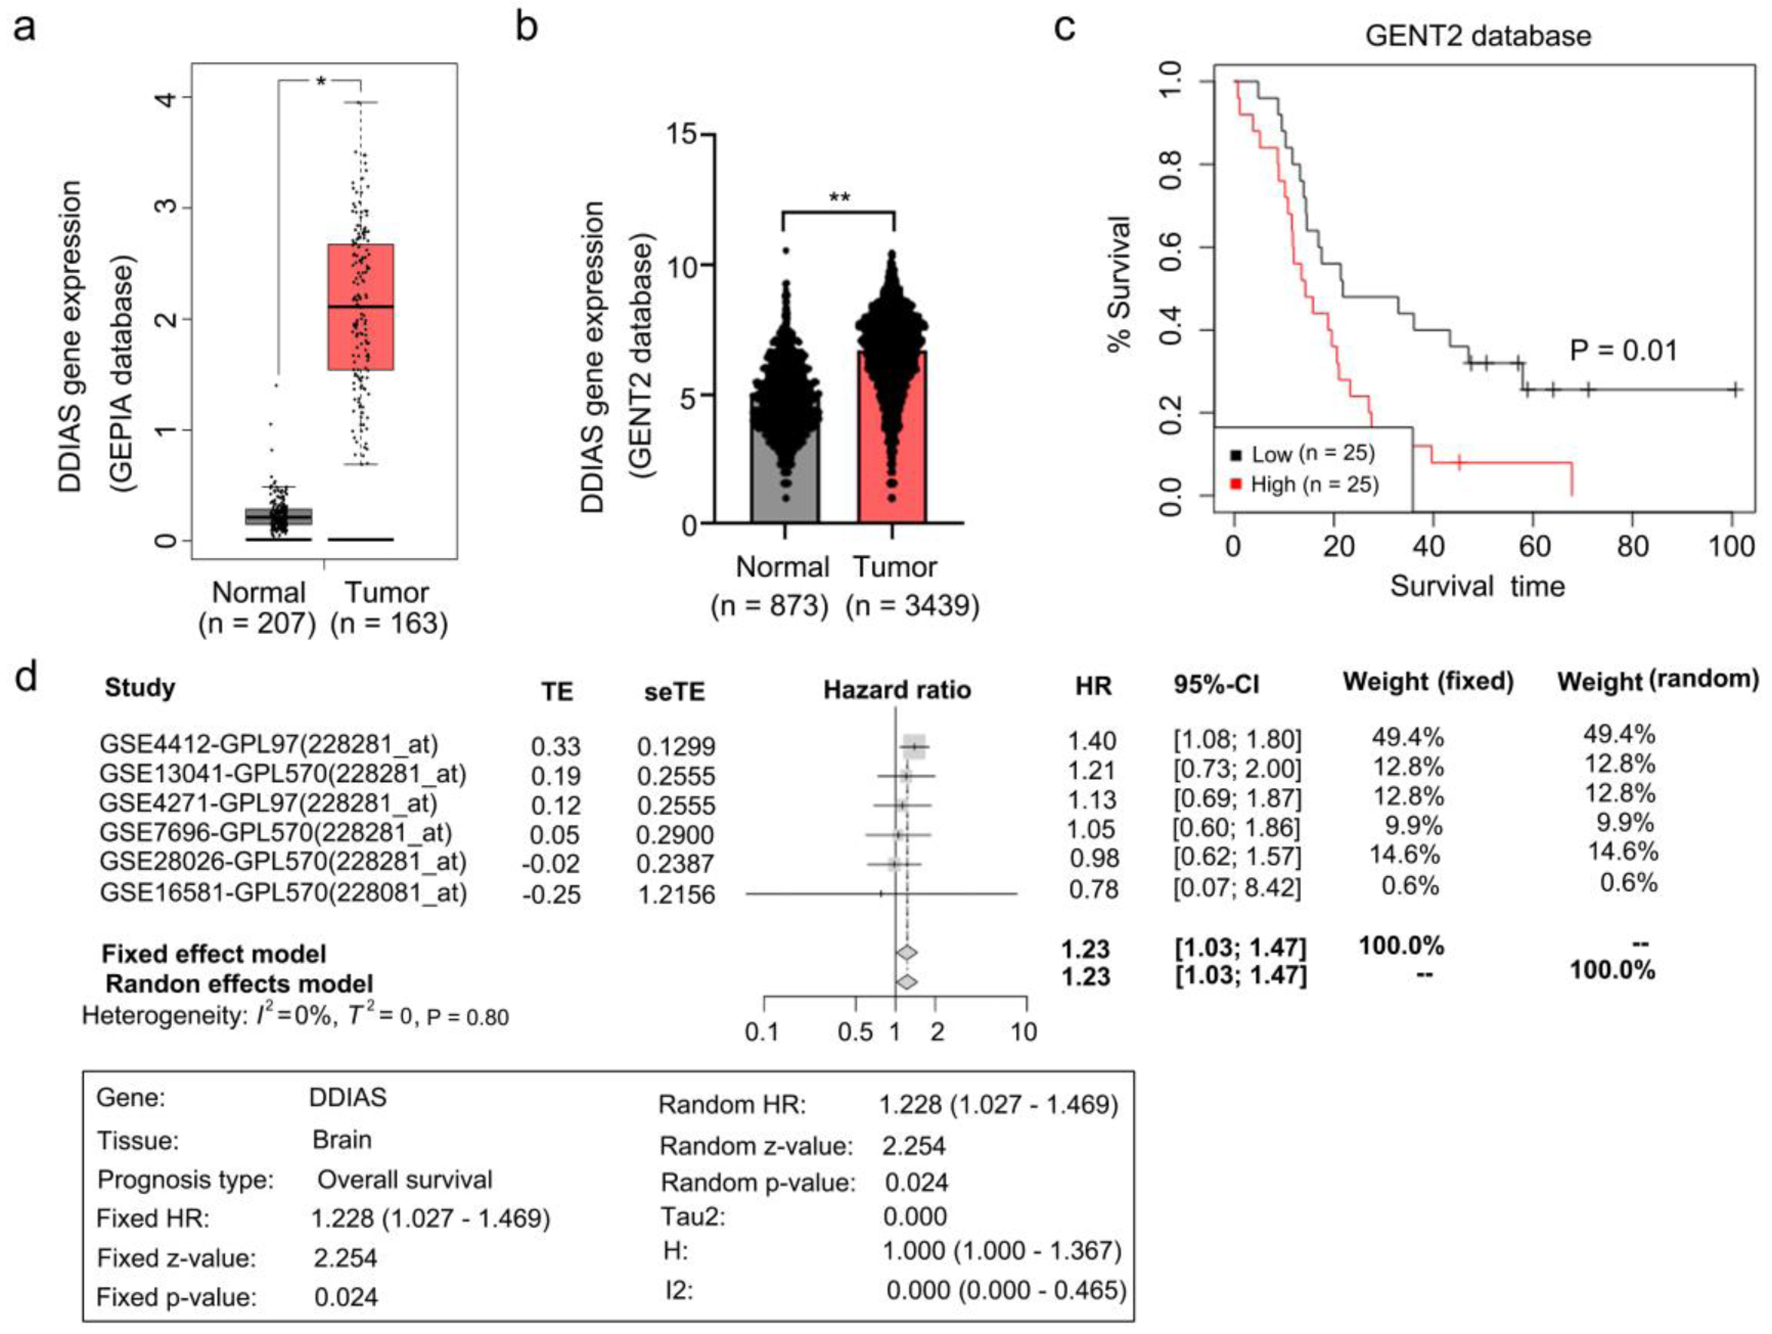 Click for large image | Figure 1. DDIAS is overexpressed in glioma and associated with glioma progression. (a, b) Expression of DDIAS in the GEPIA and GENT2 databases. (c) Overall survival analysis of patients with high or low DDIAS expression levels in the GENT2 database. (d) A meta-survival analysis by GENT2 was used to further confirm the prognostic relevance of DDIAS in glioma. *P < 0.05, **P < 0.01 as compared to the normal group. DDIAS: DNA damage-induced apoptosis suppressor; GEPIA: Gene Expression Profiling Interactive Analysis server; GENT2: Gene Expression database of Normal and Tumor tissue 2. |
DDIAS downregulation inhibited glioma cell proliferation, invasion and migration
To determine the biological functions of DDIAS in glioma progression, we first detected the protein levels of DDIAS in four glioma cell lines (U251, U87-MG, A172 and U118). Our results showed that the DDIAS protein level was high in the U87-MG and U251 cell lines compared with the other two cell lines (Fig. 2a), thus U87-MG and U251 cell lines were subsequently used for knockdown experiments. To mitigate potential off-target effects, we next inhibited the expression of DDIAS protein by two individual shRNAs targeting DDIAS in U87-MG and U251 cells (Fig. 2b). CCK-8 and EdU assays demonstrated that DDIAS knockdown inhibited cell viability and proliferation rates (Fig. 2c, d). Transwell assays revealed that DDIAS knockdown suppressed U87-MG and U251 cell invasion and migration (Fig. 2e). To further exclude the off-target impact in our study, we determined if DDIAS overexpression could restore the effects of DDIAS knockdown in U87-MG and U251 cells. We constructed the validated shDDIAS-2-resistant mutant form that contains several mismatches but synonymous mutations (Supplementary Material 1a, www.wjon.org). We observed that the inhibitory effects on DDIAS expression were fully rescued by the exogenous expression of shDDIAS-2-resistant DDIAS vectors (Supplementary Material 1b, www.wjon.org). In addition, we showed that the inhibitory effects on cell viability, cell proliferation, cell invasion and migration of U87-MG and U251 cells induced by DDIAS knockdown could be fully rescued by the exogenous expression of shDDIAS-2-resistant DDIAS vectors (Supplementary Material 1c-e, www.wjon.org). Those results strongly suggest that DDIAS is indeed required to glioma cell growth, invasion and migration.
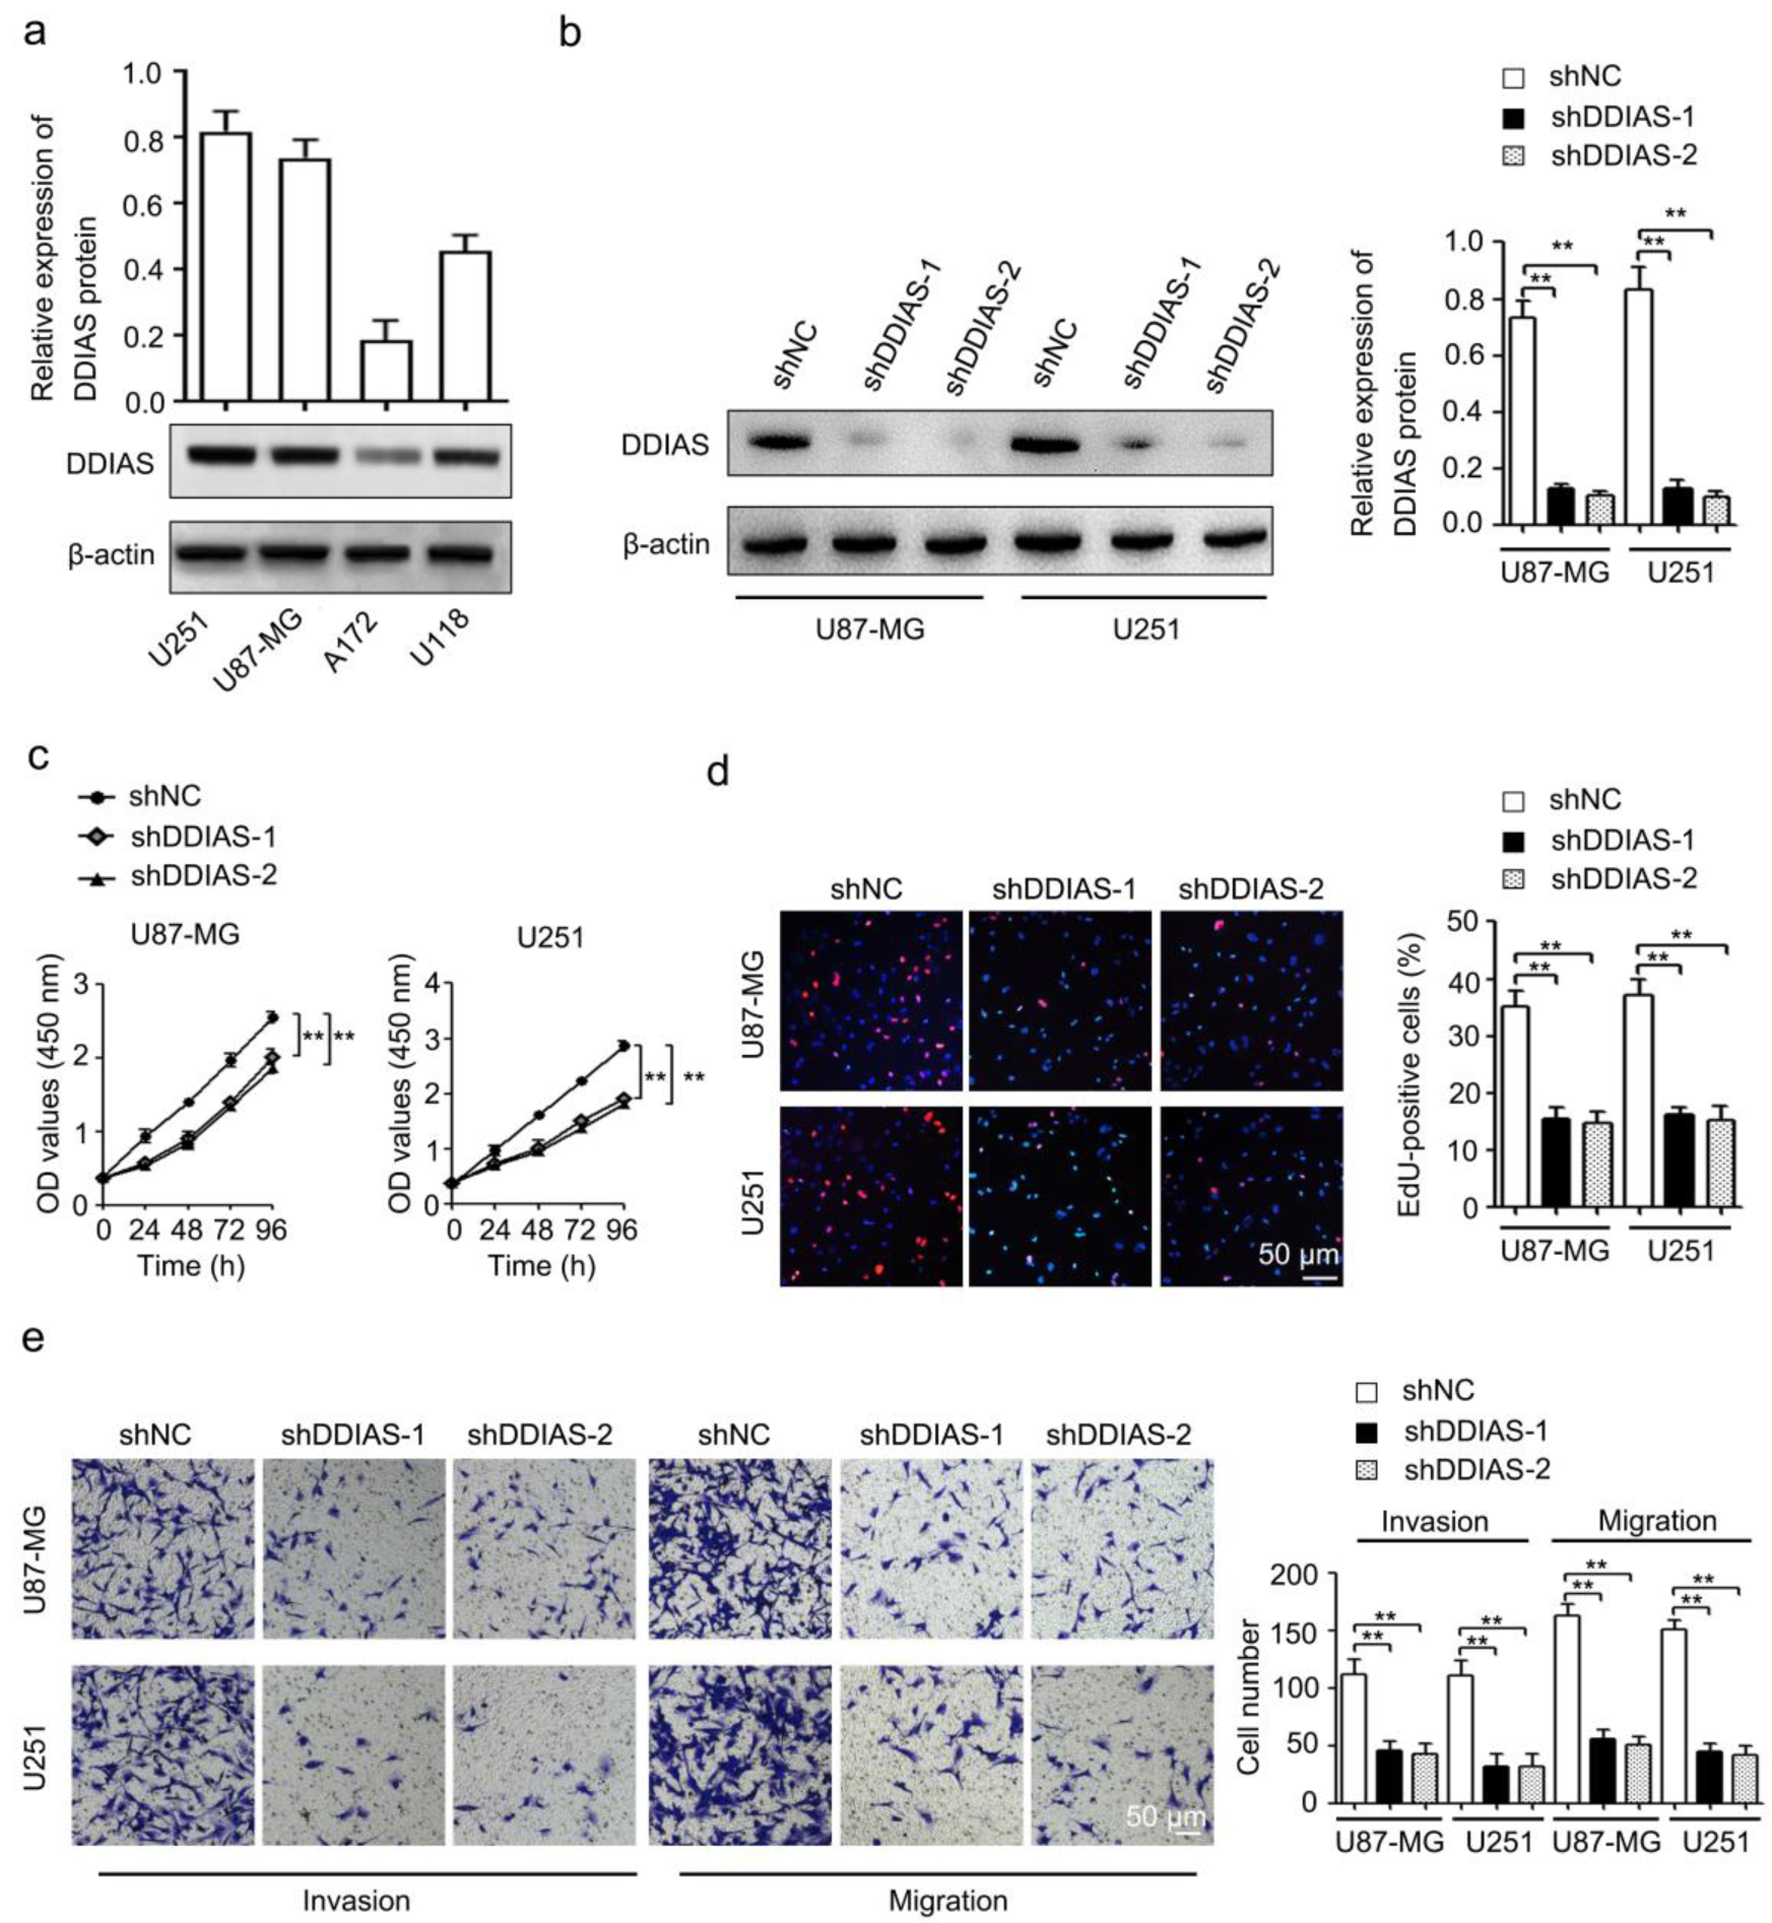 Click for large image | Figure 2. DDIAS downregulation inhibits cell viability, cell proliferation, invasion, and migration in glioma. (a) The protein expression levels of DDIAS in four glioma cell lines (U251, U87-MG, A172 and U118) were determined by western blotting. (b) The shDDIAS knockdown efficiency was determined at the protein level in U87-MG and U251 cells using western blotting. (c, d) CCK-8 and EdU assays were used to determine the cell viability and proliferation rates of U87-MG and U251 cells after transfection with shNC and shDDIAS. Scale bars, 50 µm. (e) The invasion and migration capacities of U87-MG and U251 cells with DDIAS knockdown were determined by Transwell assay. Scale bars, 50 µm. **P < 0.01 as compared to the shNC group. DDIAS: DNA damage-induced apoptosis suppressor; CCK-8: cell counting kit-8; shDDIAS: shRNA targeting DDIAS; shNC: shRNA negative control. |
DDIAS knockdown inhibited glioma growth in vivo
U251 cells stably transfected with shNC and shDDIAS-2 were injected into BALB/c male nude mice, and the tumor size was monitored every 4 days. Our results showed that tumors from the shDDIAS-2 group were significantly smaller than those from the shNC group (Fig. 3a, b). Tumor weight in the shDDIAS-2 group was significantly decreased when compared with the shNC group (Fig. 3c).
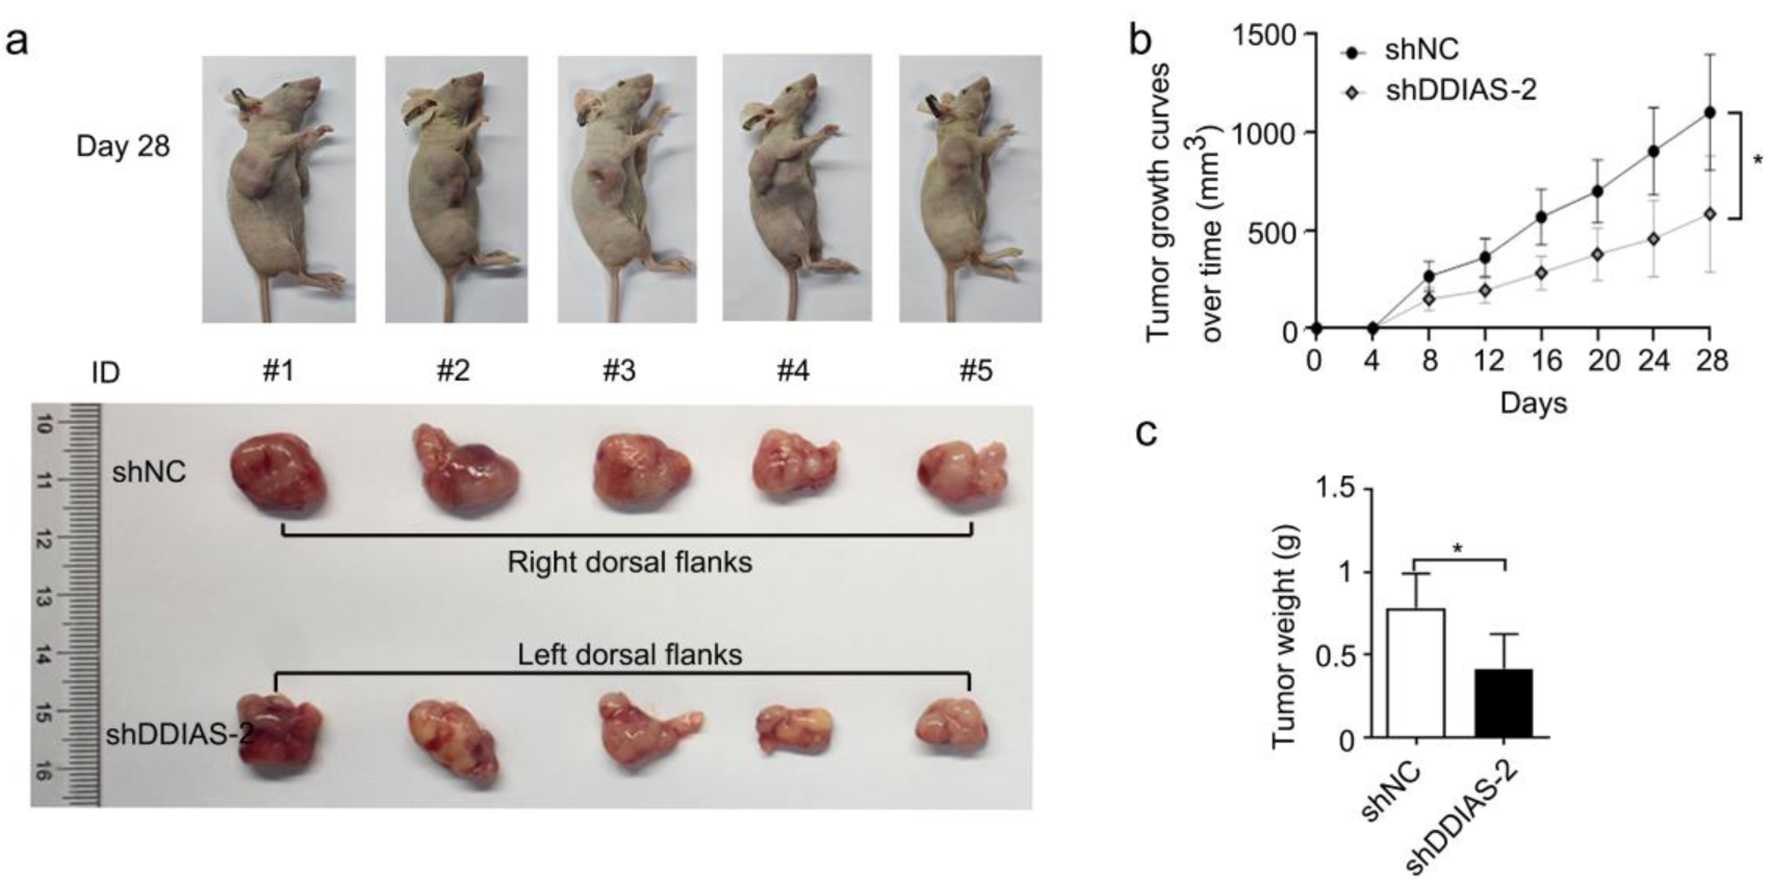 Click for large image | Figure 3. DDIAS knockdown inhibited glioma growth in vivo. (a) Representative images of mice and xenograft tumors of each group are shown. (b) The tumor volumes were measured every four days. (c) Weight of excised tumors in the shDDIAS-2 group and the shNC group. *P < 0.05 as compared to the shNC group. DDIAS: DNA damage-induced apoptosis suppressor; shDDIAS: shRNA targeting DDIAS; shNC: shRNA negative control. |
DDIAS regulatory mechanism in glioma was analyzed by RNA sequencing
To further explore the underlying molecular mechanisms by which DDIAS regulates glioma progression, RNA sequencing was performed in U251 cells after DDIAS knockdown. A total of 163 DEGs were identified, of which 103 were upregulated (FC, > 1-fold) and 60 were downregulated (FC, < -1-fold) in U251 cells with DDIAS inhibition compared with control cells (Fig. 4a). In addition, the downregulated genes were subjected to GO pathway analyses. The results from GO analysis showed that the downregulated genes were highly enriched in migration-related terms, such as cell migration in hindbrain and hindbrain radial glia guided cell migration (Fig. 4b). Among the two migration-related terms, LEF1 was significantly downregulated (Supplementary Material 2, www.wjon.org).
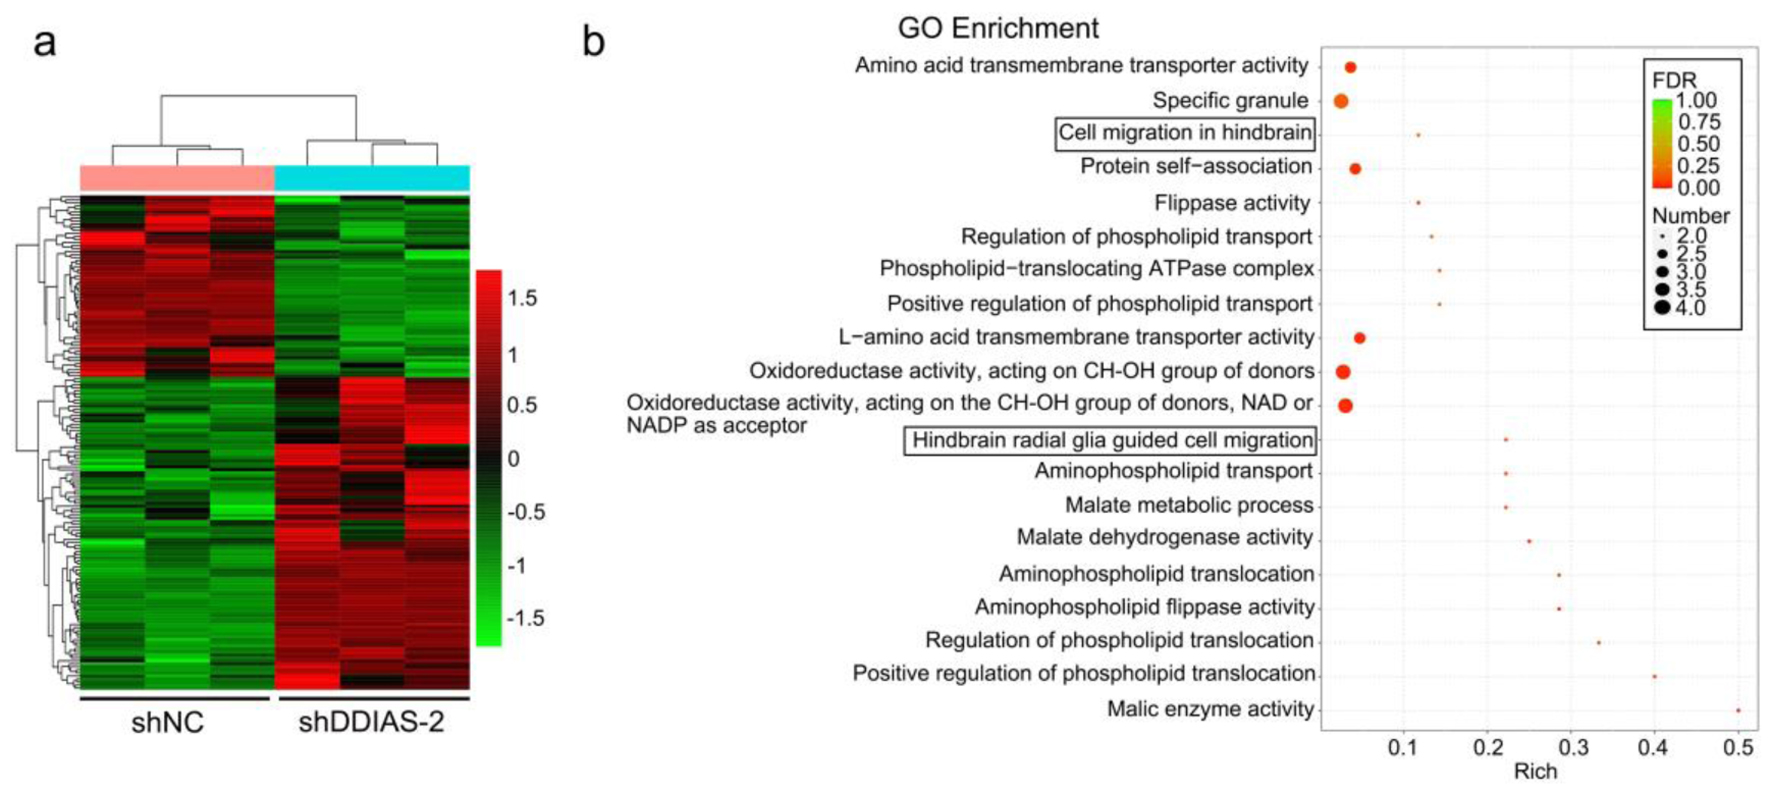 Click for large image | Figure 4. DDIAS downregulation induces DEGs in U251 cells. (a) Heatmaps showing the DEGs (FC, < -1-fold or > 1-fold) in U251 cells after transfection with shNC and shDDIAS-2. (b) GO enrichment of the downregulated genes in U251 cells after DDIAS knockdown. DDIAS: DNA damage-induced apoptosis suppressor; DEGs: differentially expressed genes; FC: fold change; shDDIAS: shRNA targeting DDIAS; shNC: shRNA negative control; GO: gene ontology. |
LEF1 was identified as the downstream effector of DDIAS
RNA sequencing showed that DDIAS knockdown inhibited LEF1 expression (Fig. 5a). Results from GEPIA and GENT2 databases showed that LEF1 gene expression was significantly upregulated in glioma tissues in comparison to normal brain tissues and was positively correlated with the expression of DDIAS (Fig. 5b, c). In addition, results from RT-qPCR and western blotting showed that LEF1 gene and protein expression levels were repressed in glioma cells after transfection with shDDIAS (Fig. 5d, e). LEF1 has been reported to be essential for tumor progression in malignant glioma [24, 25]. Thus, these findings suggested that the function of DDIAS was associated with LEF1 expression.
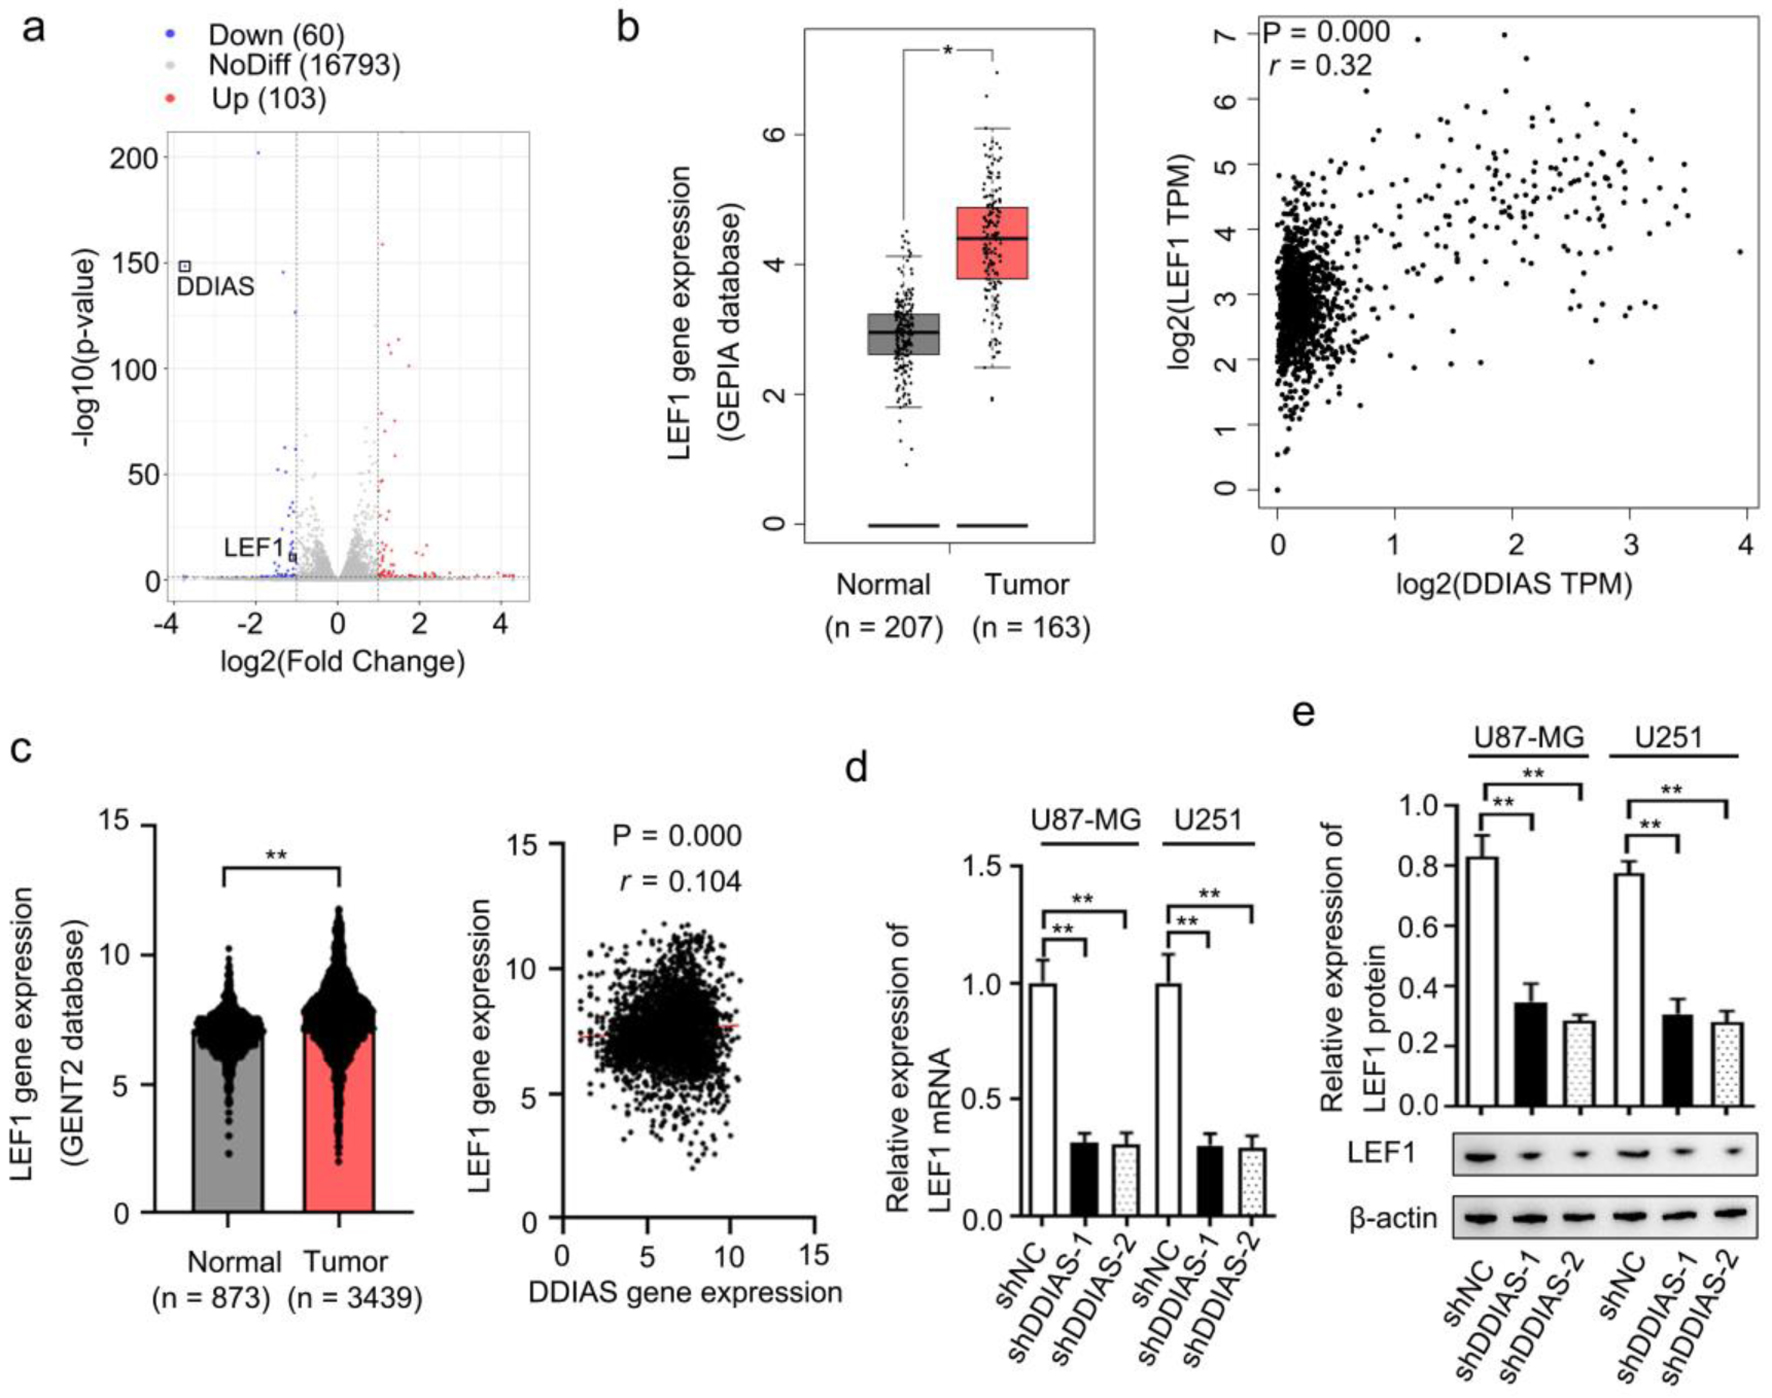 Click for large image | Figure 5. LEF1 was identified as the downstream effector of DDIAS. (a) Volcano plots showing the DEGs (FC, < -1-fold or > 1-fold) in U251 cells after DDIAS knockdown. (b) Expression of LEF1 in the GEPIA database. The association between DDIAS and LEF1 expression was determined by the Spearman’s correlation analysis (r = 0.32, P = 0.000). (c) Expression of LEF1 in the GENT2 database. The association between DDIAS and LEF1 expression was determined by the Spearman’s correlation analysis (r = 0.104, P = 0.000). (d, e) The effect of DDIAS knockdown on the expression levels of LEF1 mRNA and protein was measured by RT-qPCR and western blotting in U87-MG and U251 cells. *P < 0.05, **P < 0.01 as compared to the normal group or the shNC group. LEF1: lymphoid enhancer-binding factor 1; DDIAS: DNA damage-induced apoptosis suppressor; DEGs: differentially expressed genes; FC: fold change; GEPIA: Gene Expression Profiling Interactive Analysis server; GENT2: Gene Expression database of Normal and Tumor tissue 2; RT-qPCR: reverse transcription-quantitative polymerase chain reaction; shNC: shRNA negative control. |
DDIAS promoted glioma progression by regulating LEF1
To investigate the role of LEF1 in DDIAS-mediated glioma progression, U87-MG and U251 cells were cotransfected with the shDDIAS-2 vector and LEF1 overexpression vector (LEF1-OE). Results from the western blotting assay showed that DDIAS knockdown-induced LEF1 inhibition was significantly reversed in U87-MG and U251 cells after transfection with LEF1-OE (Fig. 6a). CCK-8 and EdU assays showed that cell viability and proliferation rates were obviously inhibited after DDIAS knockdown in U87-MG and U251 cells, but reversed after LEF1 overexpression (Fig. 6b, c). Transwell assays showed that the inhibited cell invasion and migration abilities of DDIAS downregulated U87-MG and U251 cells were also recovered after LEF1 overexpression (Fig. 6d).
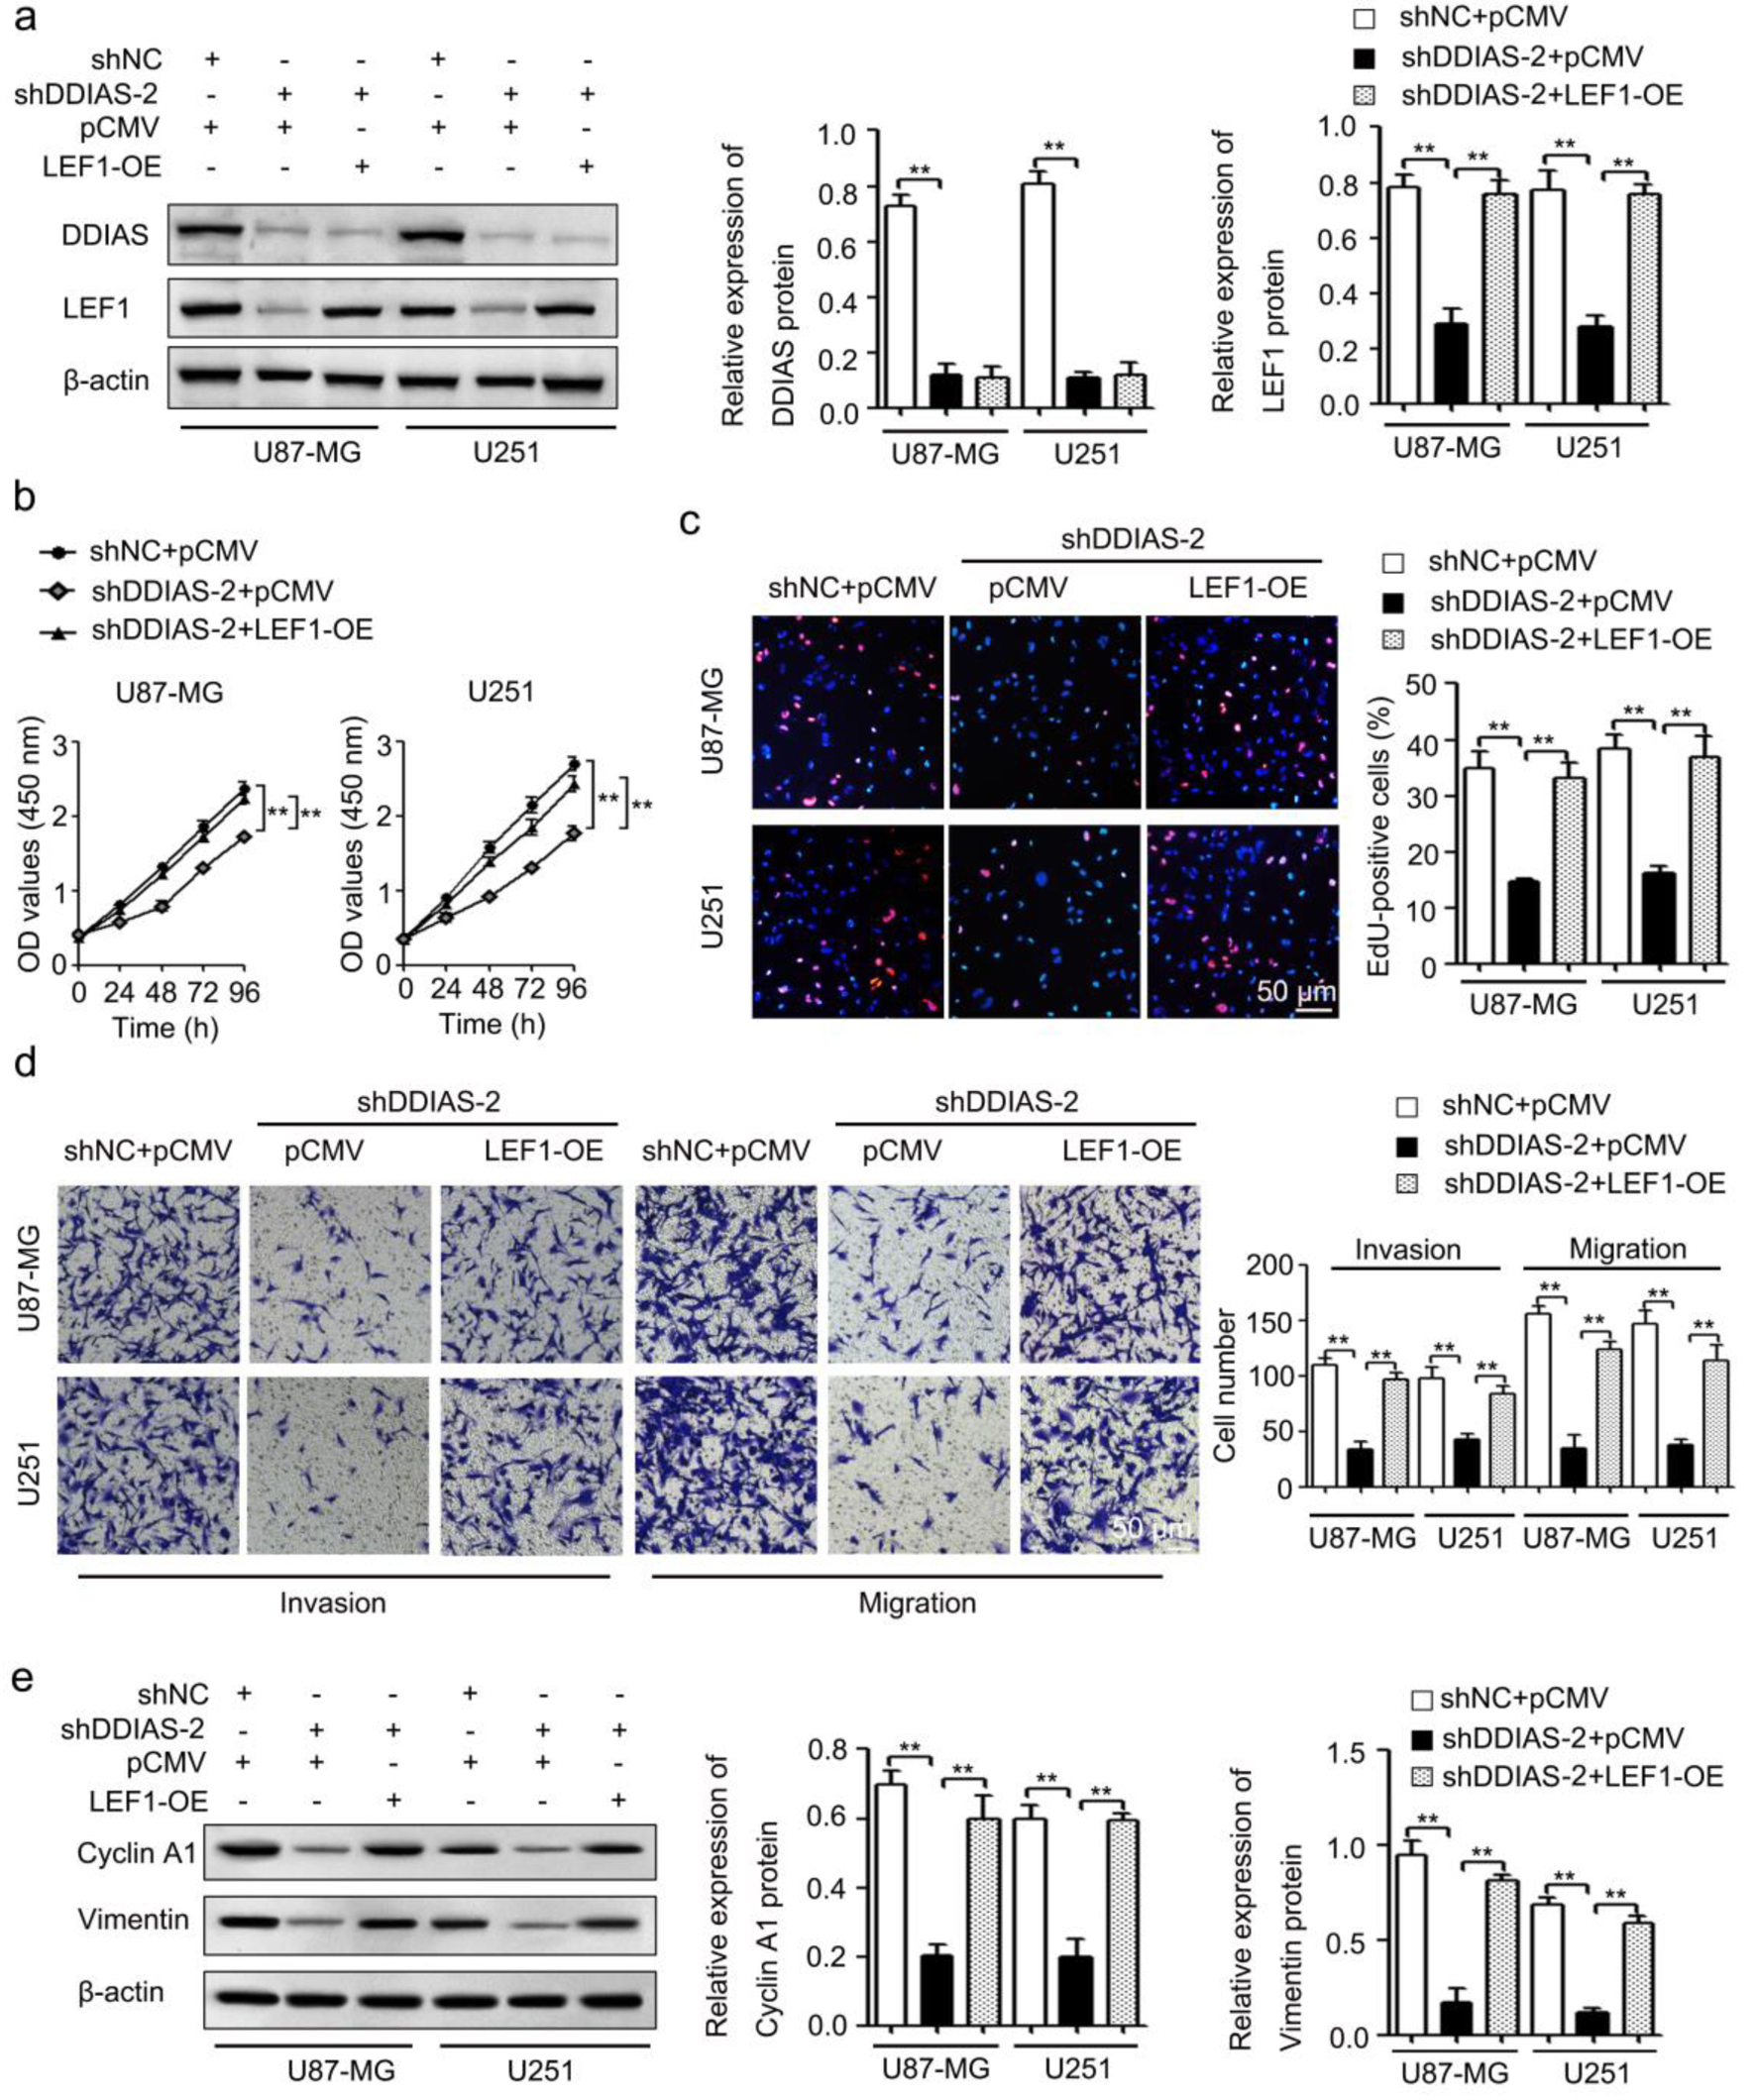 Click for large image | Figure 6. DDIAS induces glioma progression by upregulating LEF1. (a) The protein levels of DDIAS and LEF1 in U87-MG and U251 cells after cotransfection with shDDIAS-2 and LEF1-OE were measured using western blotting. (b and c) CCK-8 and EdU assays were used to determine the cell viability and proliferation rates of U87-MG and U251 cells after cotransfection with shDDIAS-2 and LEF1-OE. Scale bars, 50 µm. (d) The invasion and migration capacities of U87-MG and U251 cells cotransfected with shDDIAS-2 and LEF1-OE were determined by Transwell assay. Scale bars, 50 µm. (e) The expression levels of cyclin A1 and vimentin proteins in U87-MG and U251 cells after cotransfection with shDDIAS-2 and LEF1-OE were measured using western blotting. **P < 0.01 as compared to the shNC + pCMV group or the shDDIAS-2 + pCMV group. DDIAS: DNA damage-induced apoptosis suppressor; LEF1: lymphoid enhancer-binding factor 1; LEF1-OE: LEF1 overexpression vector; shDDIAS: shRNA targeting DDIAS; shNC: shRNA negative control. |
In breast cancer, DDIAS overexpression enhanced cell growth by regulating the positive regulators of the cell cycle, including cyclin D1 and cyclin E1 [4]. Thus, combining our RNA sequencing datasets (Supplementary Material 3, www.wjon.org) and the data in the literature [4], we determined the effect of DDIAS on the expression levels of cyclin A1, cyclin D1 and cyclin E1 mRNA. The results showed that DDIAS downregulation significantly inhibited cyclin A1 mRNA expression in U251 cells (Supplementary Material 4, www.wjon.org). Epithelial-mesenchymal transition (EMT) is closely associated with tumorigenic processes by promoting tumor invasiveness and metastatic activity [26]. Thus, we detected the levels of EMT process-related genes (E-cadherin, N-cadherin and vimentin) in U251 cells after transfection with shDDIAS-2. As shown in Supplementary Material 5 (www.wjon.org), DDIAS downregulation significantly inhibited the expression of vimentin mRNA, but did not significantly affect the expression levels of E-cadherin and N-cadherin. Western blotting assays also showed that downregulation of DDIAS repressed the protein expression of cyclin A1 and vimentin in U87-MG and U251 cells and that the reduced protein expression of cyclin A1 and vimentin caused by DDIAS knockdown in U87-MG and U251 cells was recovered after LEF1 overexpression (Fig. 6e).
DDIAS induced glioma stemness by upregulating LEF1
LEF1 can promote stem-like cell self-renewal in GBM cells [27]. Consistently, the results from our RNA sequencing datasets (Supplementary Material 3, www.wjon.org) showed that CD133 mRNA was reduced in U251 cells after DDIAS knockdown. Thus, we further investigated the effect of DDIAS on the stemness of glioma. The results showed that silencing DDIAS significantly inhibited the expression of CD133 (Fig. 7a) and decreased the sphere formation capability and self-renewal capacity of U87-MG and U251 cells (Fig. 7b, c). In addition, LEF1 overexpression rescued the inhibitory effects on CD133 expression, sphere formation capability, and self-renewal capacity of U87-MG and U251 cells induced by DDIAS knockdown (Fig. 7d-f).
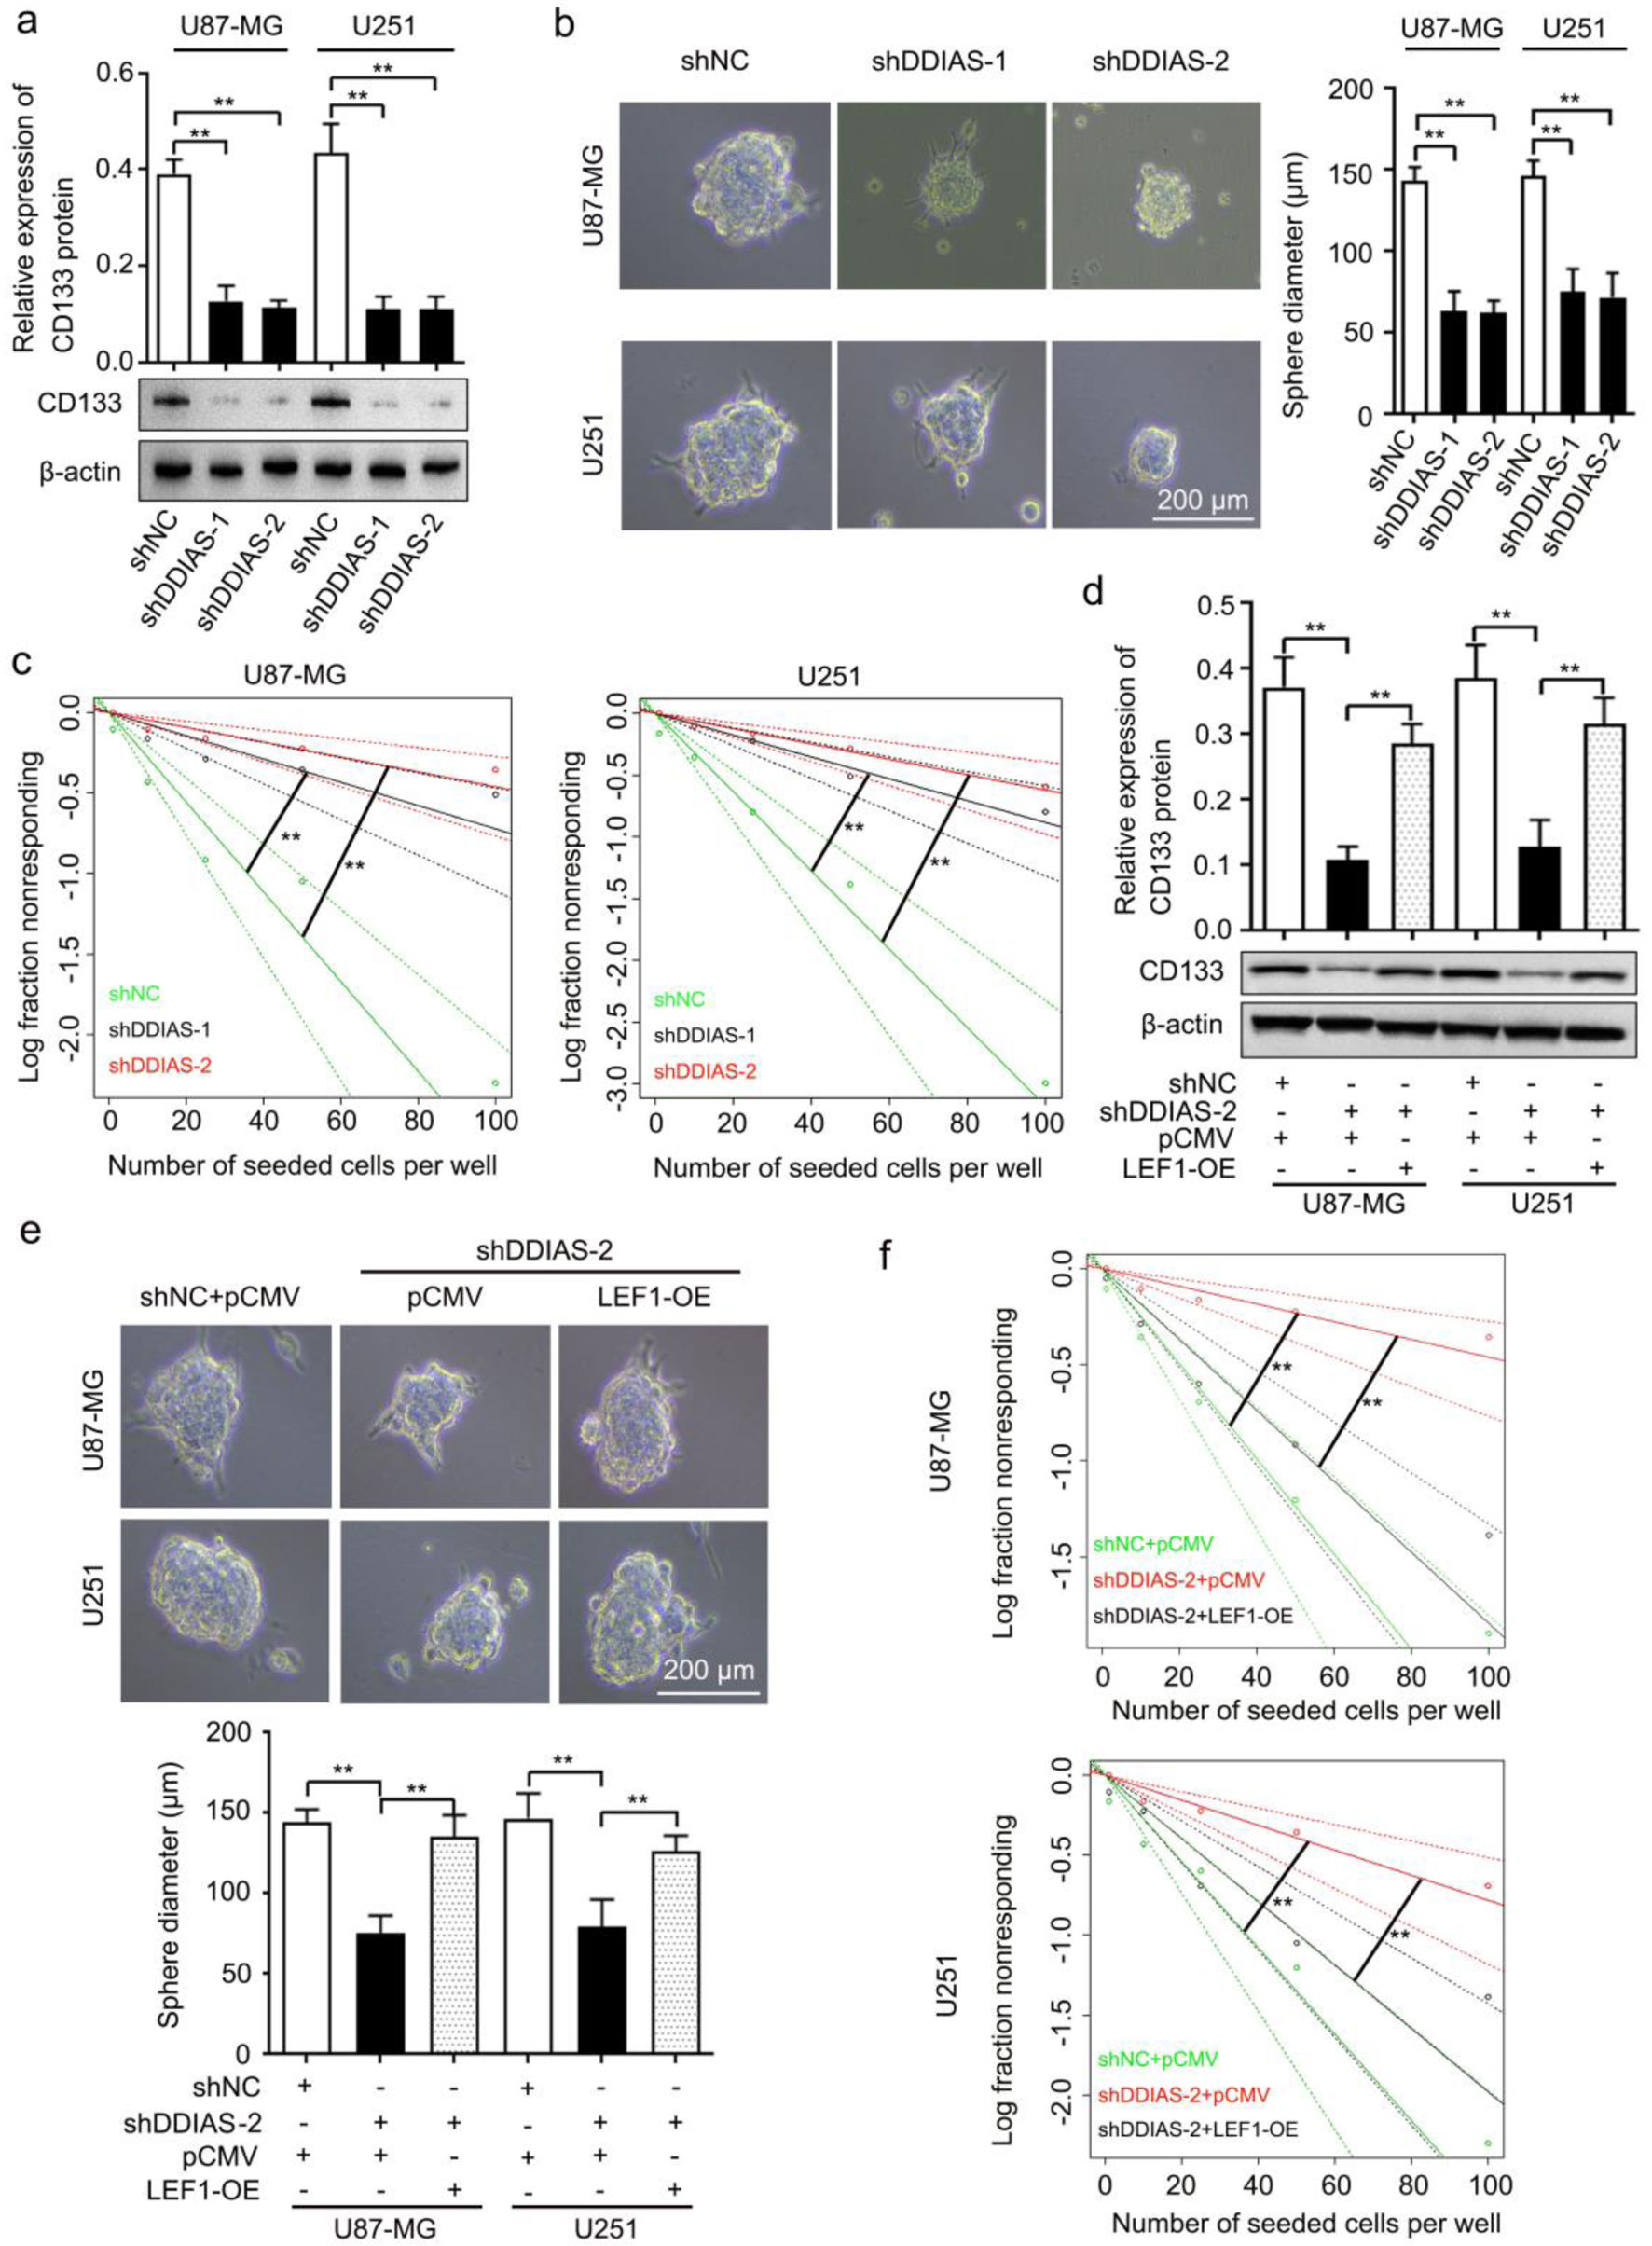 Click for large image | Figure 7. DDIAS is involved in glioma cell stemness by upregulating LEF1. (a) Western blotting analysis was performed to detect the expression level of CD133 protein in U87-MG and U251 cells after transfection with shDDIAS and shNC. (b) Representative images and quantification of the sphere formation assay in U87-MG and U251 cells after transfection with shDDIAS and shNC. Scale bars, 200 µm. (c) Limiting dilution assay was performed to detect the self-renewal capacity of U87-MG and U251 cells after transfection with shDDIAS and shNC. (d) Western blotting analysis was used to determine the expression level of CD133 protein in U87-MG and U251 cells after cotransfection with shDDIAS-2 and LEF1-OE. (e) Representative images and quantification of the sphere formation assay in U87-MG and U251 cells after cotransfection with shDDIAS-2 and LEF1-OE. Scale bars, 200 µm. (f) Limiting dilution assay was performed to detect the self-renewal capacity of U87-MG and U251 cells after cotransfection with shDDIAS-2 and LEF1-OE. **P < 0.01 as compared to the shNC group, the shNC + pCMV group or the shDDIAS-2 + pCMV group. DDIAS: DNA damage-induced apoptosis suppressor; LEF1: lymphoid enhancer-binding factor 1; shDDIAS: shRNA targeting DDIAS; shNC: shRNA negative control; LEF1-OE: LEF1 overexpression vector. |
| Discussion | ▴Top |
Despite advances in treatment, patients with GBMs still have a median survival of merely 15 months [2]. Finding novel genes involved in the regulation of glioma progression is an important way to identify potential therapeutic targets. Growing evidence has implied that DDIAS is upregulated in many malignant tumors, and upregulated DDIAS is positively correlated with poor prognosis [4-6]. Consistently, we demonstrated that DDIAS was highly expressed in glioma, and elevated DDIAS was positively correlated with poor prognosis (Fig. 1a-c). In addition, our meta-survival analysis also showed that glioma patients with high DDIAS expression were likely to have a poor prognosis (Fig. 1d). Thus, these results suggested that DDIAS may serve as a potential biomarker to predict the prognosis of glioma patients.
Previous studies have found that DDIAS promotes cell proliferation, invasion and migration and functions as an oncogene in numerous tumors, including hepatocellular carcinoma, lung cancer, cervical carcinoma and breast cancer [4-6, 28, 29]. In agreement with the oncogenic role of DDIAS, DDIAS knockdown by two individual shRNAs targeting DDIAS significantly inhibited glioma cell growth, invasion and migration in vitro and tumor growth in vivo (Figs. 2, 3). To exclude the off-target impact in our study, we reversed DDIAS expression by the validated DDIAS-Mut that contains several mismatches but synonymous mutations in U87-MG and U251 cells after transfection with shDDIAS-2 (Supplementary Material 1a, www.wjon.org). We showed that the DDIAS-Mut form did maintain a similar DDIAS expression when targeted by shDDIAS-2 (Supplementary Material 1b, www.wjon.org). Moreover, our results showed that DDIAS overexpression could restore the inhibited cell growth, invasion and migration (Supplementary Material 1c-e, www.wjon.org). Taken together, in our study DDIAS was identified as an oncogene in glioma. One previous study reported that DDIAS promotes STAT3 Y705 phosphorylation by inhibiting PTPRM/STAT3 binding, which in turn induces lung cancer progression [7]. STAT3 plays an important role in the growth and development of many human cancers [30]. In glioma, activation of STAT3 by Y705 phosphorylation is associated with more aggressive behavior, and patients with high numbers of pY705-STAT3-positive tumor cells had significantly shorter overall survival [31]. In addition, the phosphorylation of STAT3 induced by TROY increased GBM cell migration and resistance to temozolomide [32]. Therefore, we speculated that activation of STAT3 by Y705 phosphorylation may be involved in DDIAS-induced glioma progression. We further investigated the effects of DDIAS on the phosphorylation of STAT3 in U251 cells. However, we found that DDIAS knockdown did not inhibit the phosphorylation of STAT3 in U251 cells (Supplementary Material 6, www.wjon.org). Thus, we suggest that DDIAS promotes glioma progression via a STAT3-independent pathway. The mechanism of DDIAS in glioma progression still needs further investigation.
In the present study, RNA sequencing was used to identify DEGs affected by DDIAS and to explore the mechanism by which DDIAS regulates glioma progression. GO analysis showed that the downregulated genes were highly enriched in two migration-related terms (Fig. 4b), which is consistent with the results in the present study, which showed that DDIAS promotes glioma cell invasion and migration. Among the two migration-related terms, LEF1 was significantly downregulated (Supplementary Material 2, www.wjon.org). Studies have revealed that LEF1 plays a critical role in various human cancers including gliomas [24, 25, 33, 34]. LEF1 protein is upregulated in malignant astrocytic brain tumors [30] and promotes glioma cell proliferation and invasion [24, 33, 35]. Similarly, our data showed that LEF1 gene expression was significantly upregulated in glioma tissues (Fig. 5b, c). In addition, DDIAS downregulation inhibited the gene and protein expression level of LEF1 (Fig. 5d, e). Therefore, we speculated that DDIAS may induce glioma progression by regulating the expression of LEF1. Consistent with this speculation, we found that LEF1 overexpression reversed the inhibition of cell viability, proliferation rates, invasion and migration induced by DDIAS downregulation in glioma cells (Fig. 6b-d). In the present study, we found that DDIAS downregulation significantly inhibited the expression of cyclin A1 protein in glioma cells (Fig. 6e), and LEF1 overexpression rescued the inhibitory effect of cyclin A1 expression induced by DDIAS knockdown (Fig. 6e). Notably, previous studies reported conflicting data on the interactions between the positive regulators of the cell cycle and DDIAS [4, 6]. In breast cancer and hepatocellular carcinoma, DDIAS mainly regulates cyclin D1 and cyclin E1 expression, but does not affect cyclin A1 expression [4, 6]. Thus, the downstream regulatory genes for DDIAS may be significantly different in different types of tumors. It is well established that EMT plays an important role in tumor metastasis, accompanied by profound changes in the polarity, cell adhesion, and migratory properties of tumor cells [36, 37]. Moreover, a series of studies clearly demonstrated that LEF1 contributes to inducing EMT in many cancers [33, 38, 39]. Our work further determined the effect of DDIAS on EMT in glioma cells. We revealed that the EMT marker vimentin was significantly inhibited by DDIAS downregulation in glioma cells. Since DDIAS knockdown inhibited LEF1, LEF1 may be involved in DDIAS-mediated EMT. Consistent with this speculation, we demonstrated that LEF1 overexpression reversed the inhibitory effect of vimentin expression induced by DDIAS downregulation (Fig. 6e).
Cancer stem cells (CSCs) play a critical role in tumor initiation [40, 41], metastasis [42, 43] and radiotherapy or chemotherapy-induced resistance [44, 45]. Accumulating studies have revealed that LEF1 can promote CSC tumor growth, invasion and self-renewal in many types of cancers, including glioma [34, 46, 47]. In glioma, miR-452 downregulation promotes stem-like traits and tumorigenicity of glioma by inducing LEF1, Bim-1 and transcription factor 4 (TCF4) [48]. In addition, RNA sequencing showed that DDIAS downregulation inhibited the CSC marker CD133 (Supplementary Material 3, www.wjon.org). Given that DDIAS induced LEF1 expression in glioma cells, further investigations are necessary to define the contribution of DDIAS in CSCs. We found that DDIAS knockdown significantly decreased CD133 expression, the sphere formation capability, and self-renewal capacity of U87-MG and U251 cells (Fig. 7a-c), and LEF1 overexpression reversed the inhibitory effects of CD133 expression on the sphere formation capability, and self-renewal capacity induced by DDIAS downregulation (Fig. 7d-f). Thus, these results imply that DDIAS promotes glioma stemness by mediating LEF1.
In summary, we revealed that DDIAS is a novel predictor of poor prognosis and induces cyclin A1, vimentin and CD133 expression by regulating LEF1, resulting in the enhancement of cell proliferation, invasion, migration and stemness. Further studies are required to determine the molecular mechanisms by which DDIAS increases LEF1 expression.
| Supplementary Material | ▴Top |
Suppl 1. The validated DDIAS-Mut that contains several mismatches but synonymous mutations reverse the effects caused by shDDIAS-2.
Suppl 2. The genes in GO terms.
Suppl 3. The genes expression in our RNA sequencing datasets.
Suppl 4. DDIAS downregulation inhibited cyclin A1 mRNA expression in U251 cells.
Suppl 5. DDIAS downregulation inhibited vimentin mRNA expression in U251 cells.
Suppl 6. DDIAS knockdown did not affect the phosphorylation of STAT3 in U251 cells.
Acknowledgments
None to declare.
Financial Disclosure
This research was funded by the Science and Technology Project of Sichuan Province of China (No. 2022YFS0031) and the Sichuan Science and Technology Program (No. 2022YFS0621).
Conflict of Interest
The authors declare that they have no competing interests.
Informed Consent
Not applicable.
Author Contributions
LSL, YLC and YL conceived and designed the study. LSL, YLC and YL performed the experiments. LSL, YX, JSX, HWS, AQY and GJC collected the data and analyzed the data. LSL, YLC and YL drafted the manuscript and revised the manuscript. All authors have read and approved the final manuscript.
Data Availability
The datasets used and/or analyzed during the current study are available from the corresponding author on reasonable request.
Abbreviations
DDIAS: DNA damage-induced apoptosis suppressor; GEPIA: Gene Expression Profiling Interactive Analysis server; GENT2: Gene Expression database of Normal and Tumor tissue 2; shRNA: short hairpin RNA; DDIAS-Mut: shDDIAS-2-resistant mutant form of DDIAS; pcDNA3.1: pcDNA3.1 vector; CCK-8: cell counting kit-8; LEF1: lymphoid enhancer-binding factor 1; C11orf82: chromosome 11 open reading frame 82; PTPRM: protein tyrosine phosphatase receptor mu; STAT3: signal transducer and activator of transcription 3; TRAIL: tumor necrosis factor-related apoptosis-inducing ligand; FBS: fetal bovine serum; RT-qPCR: reverse transcription-quantitative polymerase chain reaction; HRP: horseradish peroxidase; shNC: shRNA negative control; shDDIAS: shRNA targeting DDIAS; DEGs: differentially expressed genes; GO: gene ontology; FC: fold change; SRA: Sequence Read Archive; LEF1-OE: LEF1 overexpression vector; GBMs: glioblastomas; EMT: epithelial-mesenchymal transition; CSCs: cancer stem cells; TCF4: transcription factor 4; HR: hazard ratio; CI: confidence interval; pCMV: pCMV-N-FLAG vectors negative control
| References | ▴Top |
- Siegel RL, Miller KD, Jemal A. Cancer statistics, 2020. CA Cancer J Clin. 2020;70(1):7-30.
doi pubmed - Jiang T, Nam DH, Ram Z, Poon WS, Wang J, Boldbaatar D, Mao Y, et al. Clinical practice guidelines for the management of adult diffuse gliomas. Cancer Lett. 2021;499:60-72.
doi pubmed - Nakaya N, Hemish J, Krasnov P, Kim SY, Stasiv Y, Michurina T, Herman D, et al. noxin, a novel stress-induced gene involved in cell cycle and apoptosis. Mol Cell Biol. 2007;27(15):5430-5444.
doi pubmed pmc - Zhang X, Zhang Y, Fan C, Wang L, Liu Y, Li A, Jiang G, et al. Noxin promotes proliferation of breast cancer cells via P38-ATF2 signaling pathway. Tumour Biol. 2017;39(6):1010428317705515.
doi pubmed - Liu N, Zhang X, Zhou H, Cai L, Li A, Miao Y, Li Q, et al. DDIAS promotes invasion and proliferation of non-small cell lung cancer and predicts poor survival of lung cancer patients. Int J Clin Exp Pathol. 2017;10(12):11506-11515.
pubmed pmc - Zhang ZZ, Huang J, Wang YP, Cai B, Han ZG. NOXIN as a cofactor of DNA polymerase-primase complex could promote hepatocellular carcinoma. Int J Cancer. 2015;137(4):765-775.
doi pubmed - Im JY, Kim BK, Lee KW, Chun SY, Kang MJ, Won M. DDIAS promotes STAT3 activation by preventing STAT3 recruitment to PTPRM in lung cancer cells. Oncogenesis. 2020;9(1):1.
doi pubmed pmc - Won KJ, Im JY, Yun CO, Chung KS, Kim YJ, Lee JS, Jung YJ, et al. Human Noxin is an anti-apoptotic protein in response to DNA damage of A549 non-small cell lung carcinoma. Int J Cancer. 2014;134(11):2595-2604.
doi pubmed - Im JY, Lee KW, Won KJ, Kim BK, Ban HS, Yoon SH, Lee YJ, et al. DNA damage-induced apoptosis suppressor (DDIAS), a novel target of NFATc1, is associated with cisplatin resistance in lung cancer. Biochim Biophys Acta. 2016;1863(1):40-49.
doi pubmed - Tang Z, Kang B, Li C, Chen T, Zhang Z. GEPIA2: an enhanced web server for large-scale expression profiling and interactive analysis. Nucleic Acids Res. 2019;47(W1):W556-W560.
doi pubmed pmc - http://gepia2.cancer-pku.cn/.
- Park SJ, Yoon BH, Kim SK, Kim SY. GENT2: an updated gene expression database for normal and tumor tissues. BMC Med Genomics. 2019;12(Suppl 5):101.
doi pubmed pmc - http://gent2.appex.kr/gent2/.
- Livak KJ, Schmittgen TD. Analysis of relative gene expression data using real-time quantitative PCR and the 2(-Delta Delta C(T)) Method. Methods. 2001;25(4):402-408.
doi pubmed - Gu G, Gao T, Zhang L, Chen X, Pang Q, Wang Y, Wang D, et al. NKAP alters tumor immune microenvironment and promotes glioma growth via Notch1 signaling. J Exp Clin Cancer Res. 2019;38(1):291.
doi pubmed pmc - Wang Y, Yang J, Wild AT, Wu WH, Shah R, Danussi C, Riggins GJ, et al. G-quadruplex DNA drives genomic instability and represents a targetable molecular abnormality in ATRX-deficient malignant glioma. Nat Commun. 2019;10(1):943.
doi pubmed pmc - Hou X, Liu Y, Liu H, Chen X, Liu M, Che H, Guo F, et al. PERK silence inhibits glioma cell growth under low glucose stress by blockage of p-AKT and subsequent HK2's mitochondria translocation. Sci Rep. 2015;5:9065.
doi pubmed pmc - Bi L, Ren Y, Feng M, Meng P, Wang Q, Chen W, Jiao Q, et al. HDAC11 regulates glycolysis through the LKB1/AMPK signaling pathway to maintain hepatocellular carcinoma stemness. Cancer Res. 2021;81(8):2015-2028.
doi pubmed - Thirusangu P, Ray U, Sarkar Bhattacharya S, Oien DB, Jin L, Staub J, Kannan N, et al. PFKFB3 regulates cancer stemness through the hippo pathway in small cell lung carcinoma. Oncogene. 2022;41(33):4003-4017.
doi pubmed pmc - Gedye C, Ailles L. Isolation and characterization of cancer stem cells in vitro. Methods Mol Biol. 2013;946:181-204.
doi pubmed - Jiang Y, Zhao J, Liu Y, Hu J, Gao L, Wang H, Cui D. CircKPNB1 mediates a positive feedback loop and promotes the malignant phenotypes of GSCs via TNF-alpha/NF-kappaB signaling. Cell Death Dis. 2022;13(8):697.
doi pubmed pmc - Hu Y, Smyth GK. ELDA: extreme limiting dilution analysis for comparing depleted and enriched populations in stem cell and other assays. J Immunol Methods. 2009;347(1-2):70-78.
doi pubmed - https://bioinf.wehi.edu.au/software/elda/.
- Rosmaninho P, Mukusch S, Piscopo V, Teixeira V, Raposo AA, Warta R, Bennewitz R, et al. Zeb1 potentiates genome-wide gene transcription with Lef1 to promote glioblastoma cell invasion. EMBO J. 2018;37(15):e97115.
doi pubmed pmc - Rampazzo E, Persano L, Pistollato F, Moro E, Frasson C, Porazzi P, Della Puppa A, et al. Wnt activation promotes neuronal differentiation of glioblastoma. Cell Death Dis. 2013;4(2):e500.
doi pubmed pmc - Setlai BP, Hull R, Reis RM, Agbor C, Ambele MA, Mulaudzi TV, Dlamini Z. MicroRNA Interrelated Epithelial Mesenchymal Transition (EMT) in Glioblastoma. Genes (Basel). 2022;13(2):244.
doi pubmed pmc - Gao X, Mi Y, Ma Y, Jin W. LEF1 regulates glioblastoma cell proliferation, migration, invasion, and cancer stem-like cell self-renewal. Tumour Biol. 2014;35(11):11505-11511.
doi pubmed - Won KJ, Im JY, Kim BK, Ban HS, Jung YJ, Jung KE, Won M. Stability of the cancer target DDIAS is regulated by the CHIP/HSP70 pathway in lung cancer cells. Cell Death Dis. 2017;8(1):e2554.
doi pubmed pmc - Im JY, Yoon SH, Kim BK, Ban HS, Won KJ, Chung KS, Jung KE, et al. DNA damage induced apoptosis suppressor (DDIAS) is upregulated via ERK5/MEF2B signaling and promotes beta-catenin-mediated invasion. Biochim Biophys Acta. 2016;1859(11):1449-1458.
doi pubmed - Thomas SJ, Snowden JA, Zeidler MP, Danson SJ. The role of JAK/STAT signalling in the pathogenesis, prognosis and treatment of solid tumours. Br J Cancer. 2015;113(3):365-371.
doi pubmed pmc - Birner P, Toumangelova-Uzeir K, Natchev S, Guentchev M. STAT3 tyrosine phosphorylation influences survival in glioblastoma. J Neurooncol. 2010;100(3):339-343.
doi pubmed - Ding Z, Kloss JM, Tuncali S, Tran NL, Loftus JC. TROY signals through JAK1-STAT3 to promote glioblastoma cell migration and resistance. Neoplasia. 2020;22(9):352-364.
doi pubmed pmc - Pecina-Slaus N, Kafka A, Tomas D, Markovic L, Okstajner PK, Sukser V, Kruslin B. Wnt signaling transcription factors TCF-1 and LEF-1 are upregulated in malignant astrocytic brain tumors. Histol Histopathol. 2014;29(12):1557-1564.
doi pubmed - Santiago L, Daniels G, Wang D, Deng FM, Lee P. Wnt signaling pathway protein LEF1 in cancer, as a biomarker for prognosis and a target for treatment. Am J Cancer Res. 2017;7(6):1389-1406.
pubmed pmc - Min RQ, Ma Q. MicroRNA-381 inhibits metastasis and epithelial-mesenchymal transition of glioblastoma cells through targeting LEF1. Eur Rev Med Pharmacol Sci. 2020;24(12):6825-6833.
doi pubmed - Huang Y, Hong W, Wei X. The molecular mechanisms and therapeutic strategies of EMT in tumor progression and metastasis. J Hematol Oncol. 2022;15(1):129.
doi pubmed pmc - Brabletz S, Schuhwerk H, Brabletz T, Stemmler MP. Dynamic EMT: a multi-tool for tumor progression. EMBO J. 2021;40(18):e108647.
doi pubmed pmc - Brown TC, Sankpal NV, Gillanders WE. Functional implications of the dynamic regulation of EpCAM during epithelial-to-mesenchymal transition. Biomolecules. 2021;11(7):956.
doi pubmed pmc - Xiao L, Zhang C, Li X, Jia C, Chen L, Yuan Y, Gao Q, et al. LEF1 enhances the progression of colonic adenocarcinoma via remodeling the cell motility associated structures. Int J Mol Sci. 2021;22(19):10870.
doi pubmed pmc - Liu C, Qiang J, Deng Q, Xia J, Deng L, Zhou L, Wang D, et al. ALDH1A1 activity in tumor-initiating cells remodels myeloid-derived suppressor cells to promote breast cancer progression. Cancer Res. 2021;81(23):5919-5934.
doi pubmed - Bajaj J, Diaz E, Reya T. Stem cells in cancer initiation and progression. J Cell Biol. 2020;219(1):e201911053.
doi pubmed pmc - Seitz CM, Schroeder S, Knopf P, Krahl AC, Hau J, Schleicher S, Martella M, et al. GD2-targeted chimeric antigen receptor T cells prevent metastasis formation by elimination of breast cancer stem-like cells. Oncoimmunology. 2020;9(1):1683345.
doi pubmed pmc - Husain K, Coppola D, Yang CS, Malafa MP. Farnesyl dimethyl chromanol targets colon cancer stem cells and prevents colorectal cancer metastasis. Sci Rep. 2021;11(1):2185.
doi pubmed pmc - Muthukrishnan SD, Kawaguchi R, Nair P, Prasad R, Qin Y, Johnson M, Wang Q, et al. P300 promotes tumor recurrence by regulating radiation-induced conversion of glioma stem cells to vascular-like cells. Nat Commun. 2022;13(1):6202.
doi pubmed pmc - Cooper J, Giancotti FG. Integrin signaling in cancer: mechanotransduction, stemness, epithelial plasticity, and therapeutic resistance. Cancer Cell. 2019;35(3):347-367.
doi pubmed pmc - Hu B, Emdad L, Kegelman TP, Shen XN, Das SK, Sarkar D, Fisher PB. Astrocyte elevated gene-1 regulates beta-catenin signaling to maintain glioma stem-like stemness and self-renewal. Mol Cancer Res. 2017;15(2):225-233.
doi pubmed - Heino S, Fang S, Lahde M, Hogstrom J, Nassiri S, Campbell A, Flanagan D, et al. Lef1 restricts ectopic crypt formation and tumor cell growth in intestinal adenomas. Sci Adv. 2021;7(47):eabj0512.
doi pubmed pmc - Liu L, Chen K, Wu J, Shi L, Hu B, Cheng S, Li M, et al. Downregulation of miR-452 promotes stem-like traits and tumorigenicity of gliomas. Clin Cancer Res. 2013;19(13):3429-3438.
doi pubmed pmc
This article is distributed under the terms of the Creative Commons Attribution Non-Commercial 4.0 International License, which permits unrestricted non-commercial use, distribution, and reproduction in any medium, provided the original work is properly cited.
World Journal of Oncology is published by Elmer Press Inc.