

| World Journal of Oncology, ISSN 1920-4531 print, 1920-454X online, Open Access |
| Article copyright, the authors; Journal compilation copyright, World J Oncol and Elmer Press Inc |
| Journal website https://www.wjon.org |
Original Article
Volume 15, Number 1, February 2024, pages 45-57

Identification and Validation of a Novel Anoikis-Related Gene Signature for Predicting Survival in Patients With Serous Ovarian Cancer
Hong Yu Denga, d, Li Wen Zhangb, d, Fa Qing Tanga, Ming Zhoua, Meng Na Lia, Lei Lei Lub, e, Ying Hua Lic, e
aDepartment of Clinical Laboratory, Hunan Key Laboratory of Oncotarget Gene, Hunan Cancer Hospital and the Affiliated Cancer Hospital of Xiangya School of Medicine, Central South University, Changsha, China
bShanghai OrigiMed Co., Ltd., Shanghai 201112, China
cGynecological Oncology, Hunan Cancer Hospital and the Affiliated Cancer Hospital of Xiangya School of Medicine, Central South University, Changsha, China
dThese authors contributed equally to this work.
eCorresponding Author: Lei Lei Lu, Shanghai OrigiMed Co., Ltd., Shanghai 201112, China; Ying Hua Li, Hunan Cancer Hospital and the Affiliated Cancer Hospital of Xiangya School of Medicine, Central South University, Changsha, China
Manuscript submitted September 19, 2023, accepted November 29, 2023, published online January 10, 2024
Short title: A Novel ARGs Model for SOC Prognosis
doi: https://doi.org/10.14740/wjon1714
| Abstract | ▴Top |
Background: Ovarian cancer is an extremely deadly gynecological malignancy, with a 5-year survival rate below 30%. Among the different histological subtypes, serous ovarian cancer (SOC) is the most common. Anoikis significantly contributes to the progression of ovarian cancer. Therefore, identifying an anoikis-related signature that can serve as potential prognostic predictors for SOC is of great significance.
Methods: We intersected 308 anoikis-related genes (ARGs) and identified those significantly associated with SOC prognosis using univariate Cox regression. A LASSO Cox regression model was constructed and evaluated using Kaplan-Meier and receiver operating characteristic (ROC) analyses in TCGA (The Cancer Genome Atlas) and GSE26193 cohorts. We conducted quantitative real-time polymerase chain reaction (qPCR) to assess mRNA levels and applied bioinformatics to investigate the correlation between risk groups and gene expression, mutations, pathways, tumor immune microenvironment (TIME), and drug sensitivity in SOC.
Results: Among 308 ARGs, 28 were significantly associated with SOC prognosis. A 13-gene prognostic model was established through LASSO Cox regression in TCGA cohort. High-risk group had poorer prognosis than low-risk group (median overall survival (mOS): 34.2 vs. 57.1 months, hazard ratio (HR): 2.590, 95% confidence interval (CI): 0.159 - 6.00, P < 0.001). The area under the curve (AUC) values of 0.63, 0.65, and 0.74 reflected the predictive performance for 3-, 5-, and 8-year overall survival (OS) in GSE26193 validation cohort. Functional enrichment, pathway analysis, and TIME analysis identified distinct characteristics between risk groups. Drug sensitivity analysis revealed potential drug advantages for each group. Furthermore, qPCR validation once again confirmed the effectiveness of the risk model in SOC patients.
Conclusions: We developed and validated a robust ARG model, which could be used to predict OS in SOC patients. By systematically analyzing the correlation between the risk score of the ARGs signature model and various patterns, including the TIME and drug sensitivity, our findings suggest that this prognostic model contributes to the advancement of personalized and precise therapeutic strategies. Nevertheless, further validation studies and investigations into the underlying mechanisms are warranted.
Keywords: Anoikis; Risk score; Validation; Serous ovarian cancer; Prognosis
| Introduction | ▴Top |
Ovarian cancer, which is commonly referred to as “the silent killer”, remains a significant contributor to cancer-related mortality in women [1]. The most common histological subtype of ovarian cancer is serous ovarian cancer (SOC). Despite some achievements in surgery, chemotherapy, targeted therapy, and immunotherapy, there are currently no reliable biomarkers available to predict overall survival (OS) at an early stage [2]. This highlights the urgent need to identify novel molecular biomarkers that can improve the prognosis and therapeutic effect of SOC patients.
The poor prognosis in SOC patients is often attributed to the occurrence of metastasis. Anoikis, which is a unique type of programmed cell death, plays an essential role in upholding tissue homeostasis [3]. However, anoikis resistance in tumor cells promotes their expansion and invasion into neighboring tissues [4, 5]. Recent studies have established prognostic models utilizing anoikis-related genes (ARGs) in glioblastoma, hepatocellular carcinoma, lung adenocarcinoma and bladder urothelial carcinoma, which have demonstrated excellent predictive ability [6-9]. However, the application of ARGs in predicting the prognosis of SOC and its correlation with tumor immune microenvironment (TIME) and drug sensitivity are still limited. Thus, the development of a prognostic model incorporating ARGs may have attractive clinical values for SOC.
In our study, which exclusively utilized data from the subtype of SOC, gene expression data were retrieved from the TCGA (The Cancer Genome Atlas)-OV and GSE26193 cohorts via the cBioPortal and GEO (Gene Expression Omnibus) databases, respectively. We systematically established and validated a prognostic model based on a 13-ARG signature in patients with SOC. We also assessed the correlation between risk groups and gene expression, mutations, gene ontology (GO), signaling pathways, TIME, and drug sensitivity. Moreover, we also performed a quantitative real-time polymerase chain reaction (qPCR) experiment on 12 SOC patients. The qPCR data were utilized to calculate risk scores, which were then employed to evaluate the survival differences among the patients. The findings reinforce the reliability of the ARGs risk model in effectively stratifying patients with SOC. Notably, within the 13-ARG risk model, the mRNA expression levels of LARP1, LRP1, ABHD4, IGF1, and RB1 were significantly downregulated in SOC patients. These results might provide valuable insights into the potential prognostic indicators for SOC patients.
| Materials and Methods | ▴Top |
Data acquisition and ARGs set curation
The mRNA expression data, along with mutation data and relevant clinical information of patients with SOC, were extracted from cBioPortal website. This study included patients with an OS of more than 30 days, resulting in a total of 291 participants randomly assigned to a training cohort (n = 219) and a testing cohort (n = 72). External validation data were obtained from the GSE26193 dataset, which consisted of 107 patients with gene expression and clinical information. To preprocess the gene expression data and remove batch effects, we applied a combination of normalization and ComBat [10]. We retrieved 338 ARGs from the GeneCards website (Supplementary Material 1, www.wjon.org). The overlap of 308 ARGs between the TCGA and GSE26193 datasets was visualized utilizing the R package “VennDiagram”.
Construction of prognostic model and performance assessment
Univariate and multivariate Cox regression analyses were conducted, aiming to identify prognostically significant ARGs [11]. A 13-gene prognostic model was developed using LASSO Cox regression with the R package “glmnet” in the training cohort. The risk score was calculated as the sum of coefficients and the corresponding gene expression levels. The optimal cut-off value for the risk score, determined by the surv_cutpoint function in R, was 0.858 [12]. The distribution of risk groups was explored using principal component analysis (PCA). The area under the curve (AUC) estimators were calculated in both the TCGA testing cohort and the GSE26193 validation cohort, utilizing identically and independently distributed representations.
Mutation profile and differential expression analysis of the prognostic risk model
In the TCGA cohort, the profile of all mutation genes was displayed by “ComplexHeatmap” R package based on the risk groups. The log-transformed mRNA expression z-scores profile was converted to log2(expression). To perform specific pathway analysis of mutations, a list of genes involved in various signaling pathways was obtained here (Supplementary Material 2, www.wjon.org).
Functional enrichment and immune cell analysis
For pathway and GO functional enrichment analyses, the “clusterProfiler” R package was used. Gene set enrichment analysis was performed using gene set enrichment analysis (GSEA) software. CIBERSORT was employed to estimate the relative abundance of 22 immune cells in the expression profiles of the TCGA cohort. Single-sample GSEA was also performed using the GSVA package to evaluate the TIME in high- and low-risk patients [13].
Chemotherapeutic response prediction
The prediction of chemotherapeutic response was carried out using the “pRRophetic” R package, which utilizes data from the Genomics of Drug Sensitivity in Cancer (GDSC) database [14]. Subsequently, a comparison was made between high-risk and low-risk patients regarding drug sensitivity. Furthermore, the correlation between ARGs and drug sensitivity was determined using the Pearson correlation test with the CellMiner database.
Human tissue specimens
Ethical approval was obtained from the Institutional Review Board of Hunan Cancer Hospital for this study involving human subjects. This study was conducted in accordance with the responsible institution’s ethical standards for human subjects and in accordance with the Declaration of Helsinki. Written consent was obtained from each participant prior to their inclusion. We collected 12 fresh-frozen SOC tissue samples from patients who had not received chemotherapy or radiotherapy prior to standardized surgery, and three fresh-frozen normal ovarian tissues from patients undergoing hysterectomy or bilateral salpingo-oophorectomy for other medical conditions. Tissue samples were acquired between September 2019 and July 2020, with diagnoses confirmed by expert pathologists at Hunan Cancer Hospital.
qPCR
Total RNA was extracted from the samples using the TRIzol reagent (Accurate Biotechnology, Hunan, China) following the provided instructions. The RNA was reverse transcribed to cDNA using the Evo M-MLV RT Premix (Accurate Biotechnology, Hunan, China). Quantitative PCR was then conducted on the Bio-Rad CFX96 Touch Sequence Detection System using the SYBR® Green Premix Pro Taq HS qPCR kit (Accurate Biotechnology, Hunan, China), with primer sequences listed here (Supplementary Material 3, www.wjon.org). Relative gene expression was quantified using the 2-ΔΔCT method, normalized to glyceraldehyde 3-phosphate dehydrogenase (GAPDH), and performed in triplicate.
Statistical analysis
All statistical analyses were conducted using R (version 3.5.1). The Kruskal-Wallis test was used to compare more than two groups, while the Wilcoxon test was utilized to compare two groups. The Kaplan-Meier (K-M) survival curves were generated using the R package “survminer” and the log-rank test was applied to compare the survival curves in different groups. Various endpoints of OS at 3, 5 and 8 years were investigated. To evaluate the model’s performance, the R package “timeROC” was employed. Boxplots were created using the “ggplot2” package in R. Statistical significance was defined as P < 0.05. P < 0.05 is marked as *, P < 0.01 is marked as **, and P < 0.001 is marked as ***.
| Results | ▴Top |
Construction of the anoikis-related risk signature model on the training cohort of SOC patients
The study’s workflow is depicted in Figure 1. A total of 308 intersecting ARGs were identified among TCGA-OV, GSE26193 and GeneCards datasets (Fig. 2a). In the TCGA training cohort, we performed univariate Cox regression analysis to determine prognostic ARGs in patients with SOC [15]. As a result, 28 ARGs were found to be significantly associated with OS (P < 0.05) (Supplementary Material 4, www.wjon.org). LASSO Cox regression and multivariate Cox regression were subsequently performed to identify a novel ARGs signature. Thirteen ARGs (NTRK2, FN1, MTOR, IGF1, ABHD4, HMCN1, CDKN1B, KRAS, MAVS, RB1, CRYAB, LRP1, LPAR1) were retained for model construction when achieving the optimal lambda value (Supplementary Material 6A, B, www.wjon.org). We then derived the risk score formula for each patient as follows: risk score = (0.2639) × NTRK2 + (0.1024) × FN1 + (0.0304) × MTOR + (0.1430) × IGF1+ (0.1068) × ABHD4+ (-0.0027) × HMCN1+ (0.2063) × CDKN1B+ (0.1624) × KRAS+ (0.1638) × MAVS+ (0.1000) × RB1+ (0.2237) × CRYAB+ (-0.0183) × LRP1+ (0.0750) × LPAR1. To investigate whether these 13 ARGs could be used as independent factors for evaluating ovarian cancer prognosis, univariate and multivariate analyses were carried out. The results indicated that NTRK2, CDKN1B, KRAS, and CRYAB exhibit potential as independent prognostic indicators in patients with SOC (Fig. 2b, c).
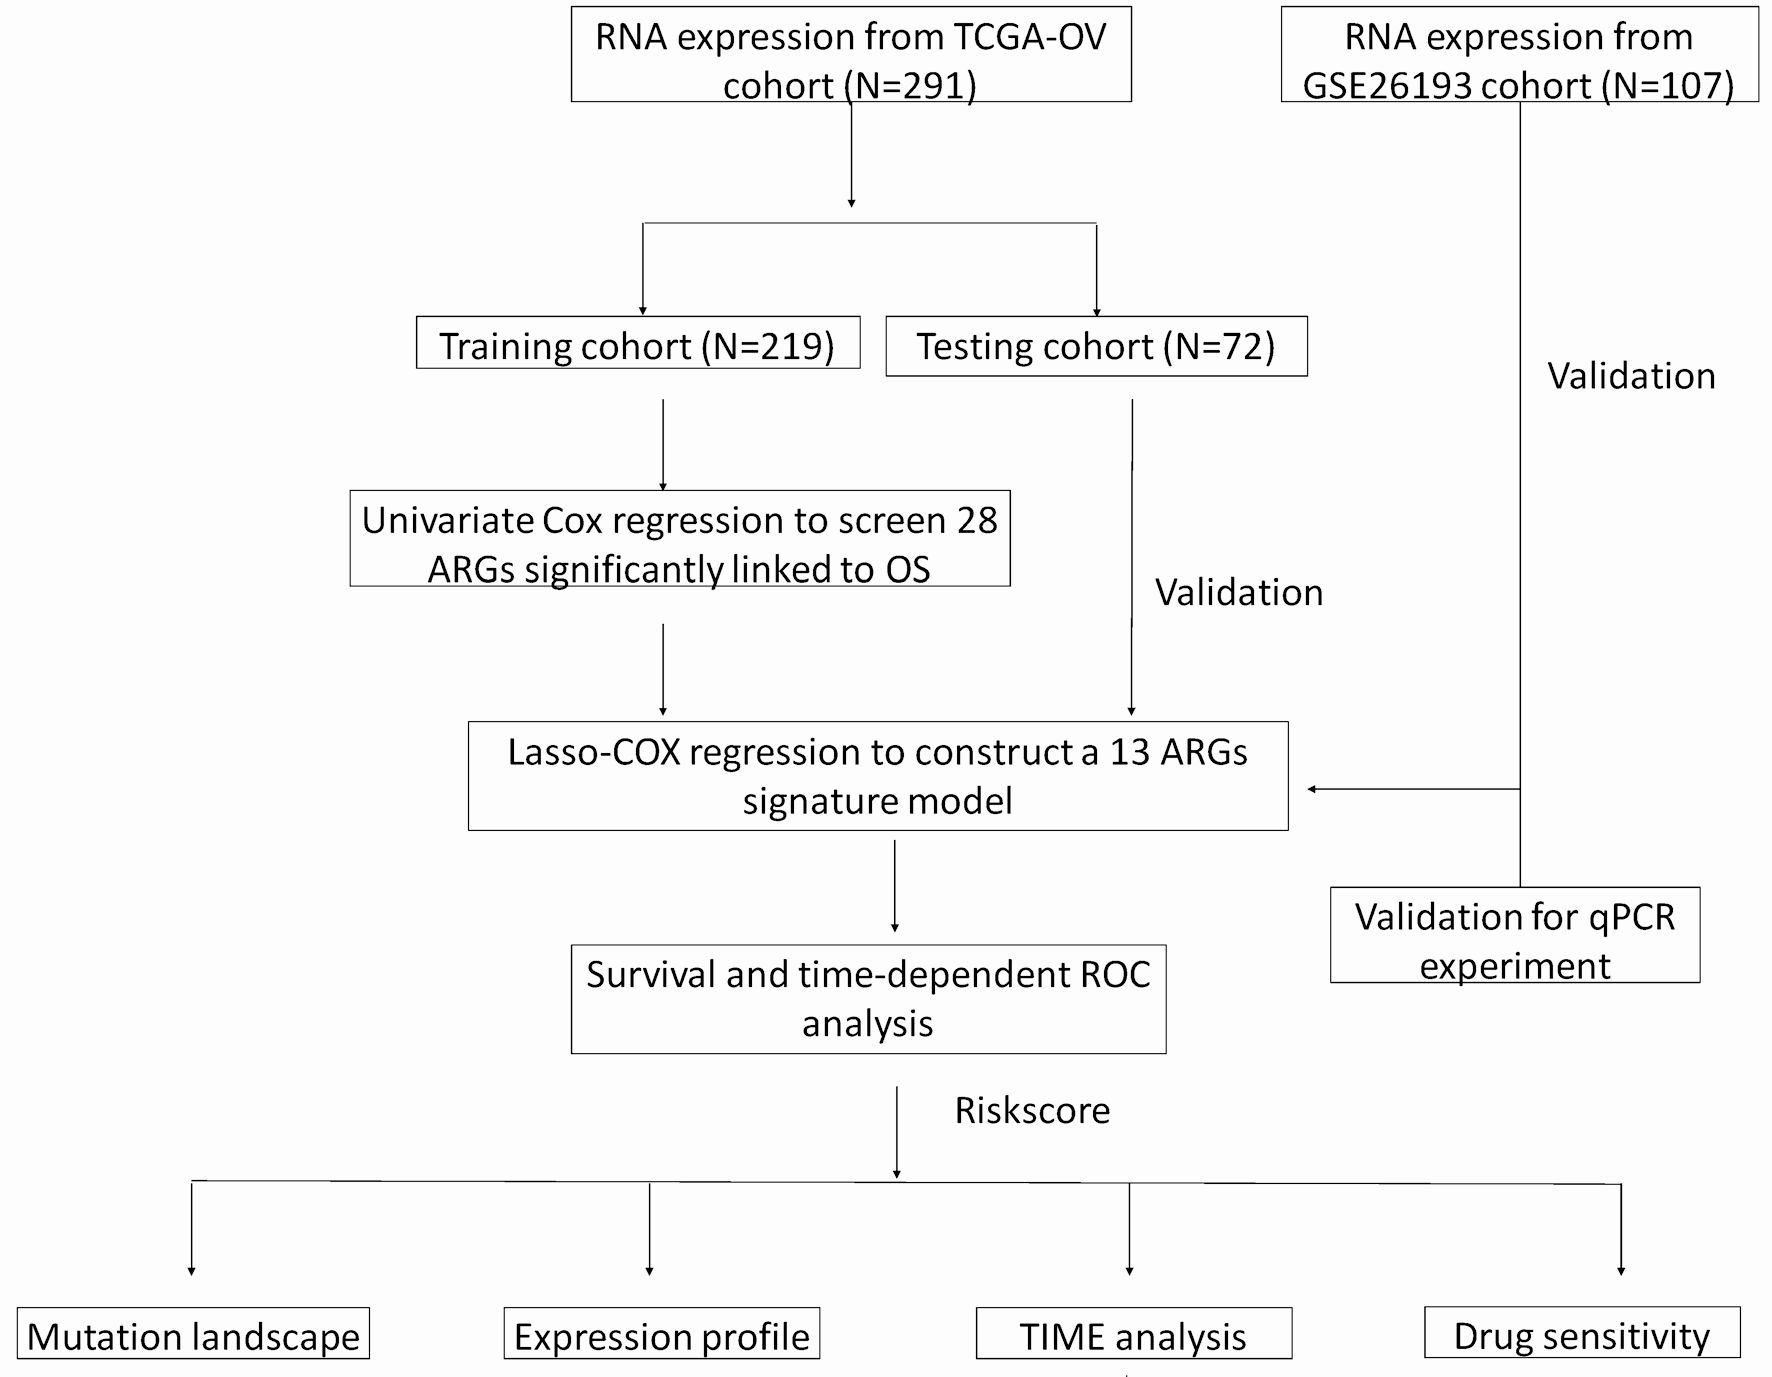 Click for large image | Figure 1. A flow chart of identification and validation of a novel anoikis-related signature for SOC prognosis. |
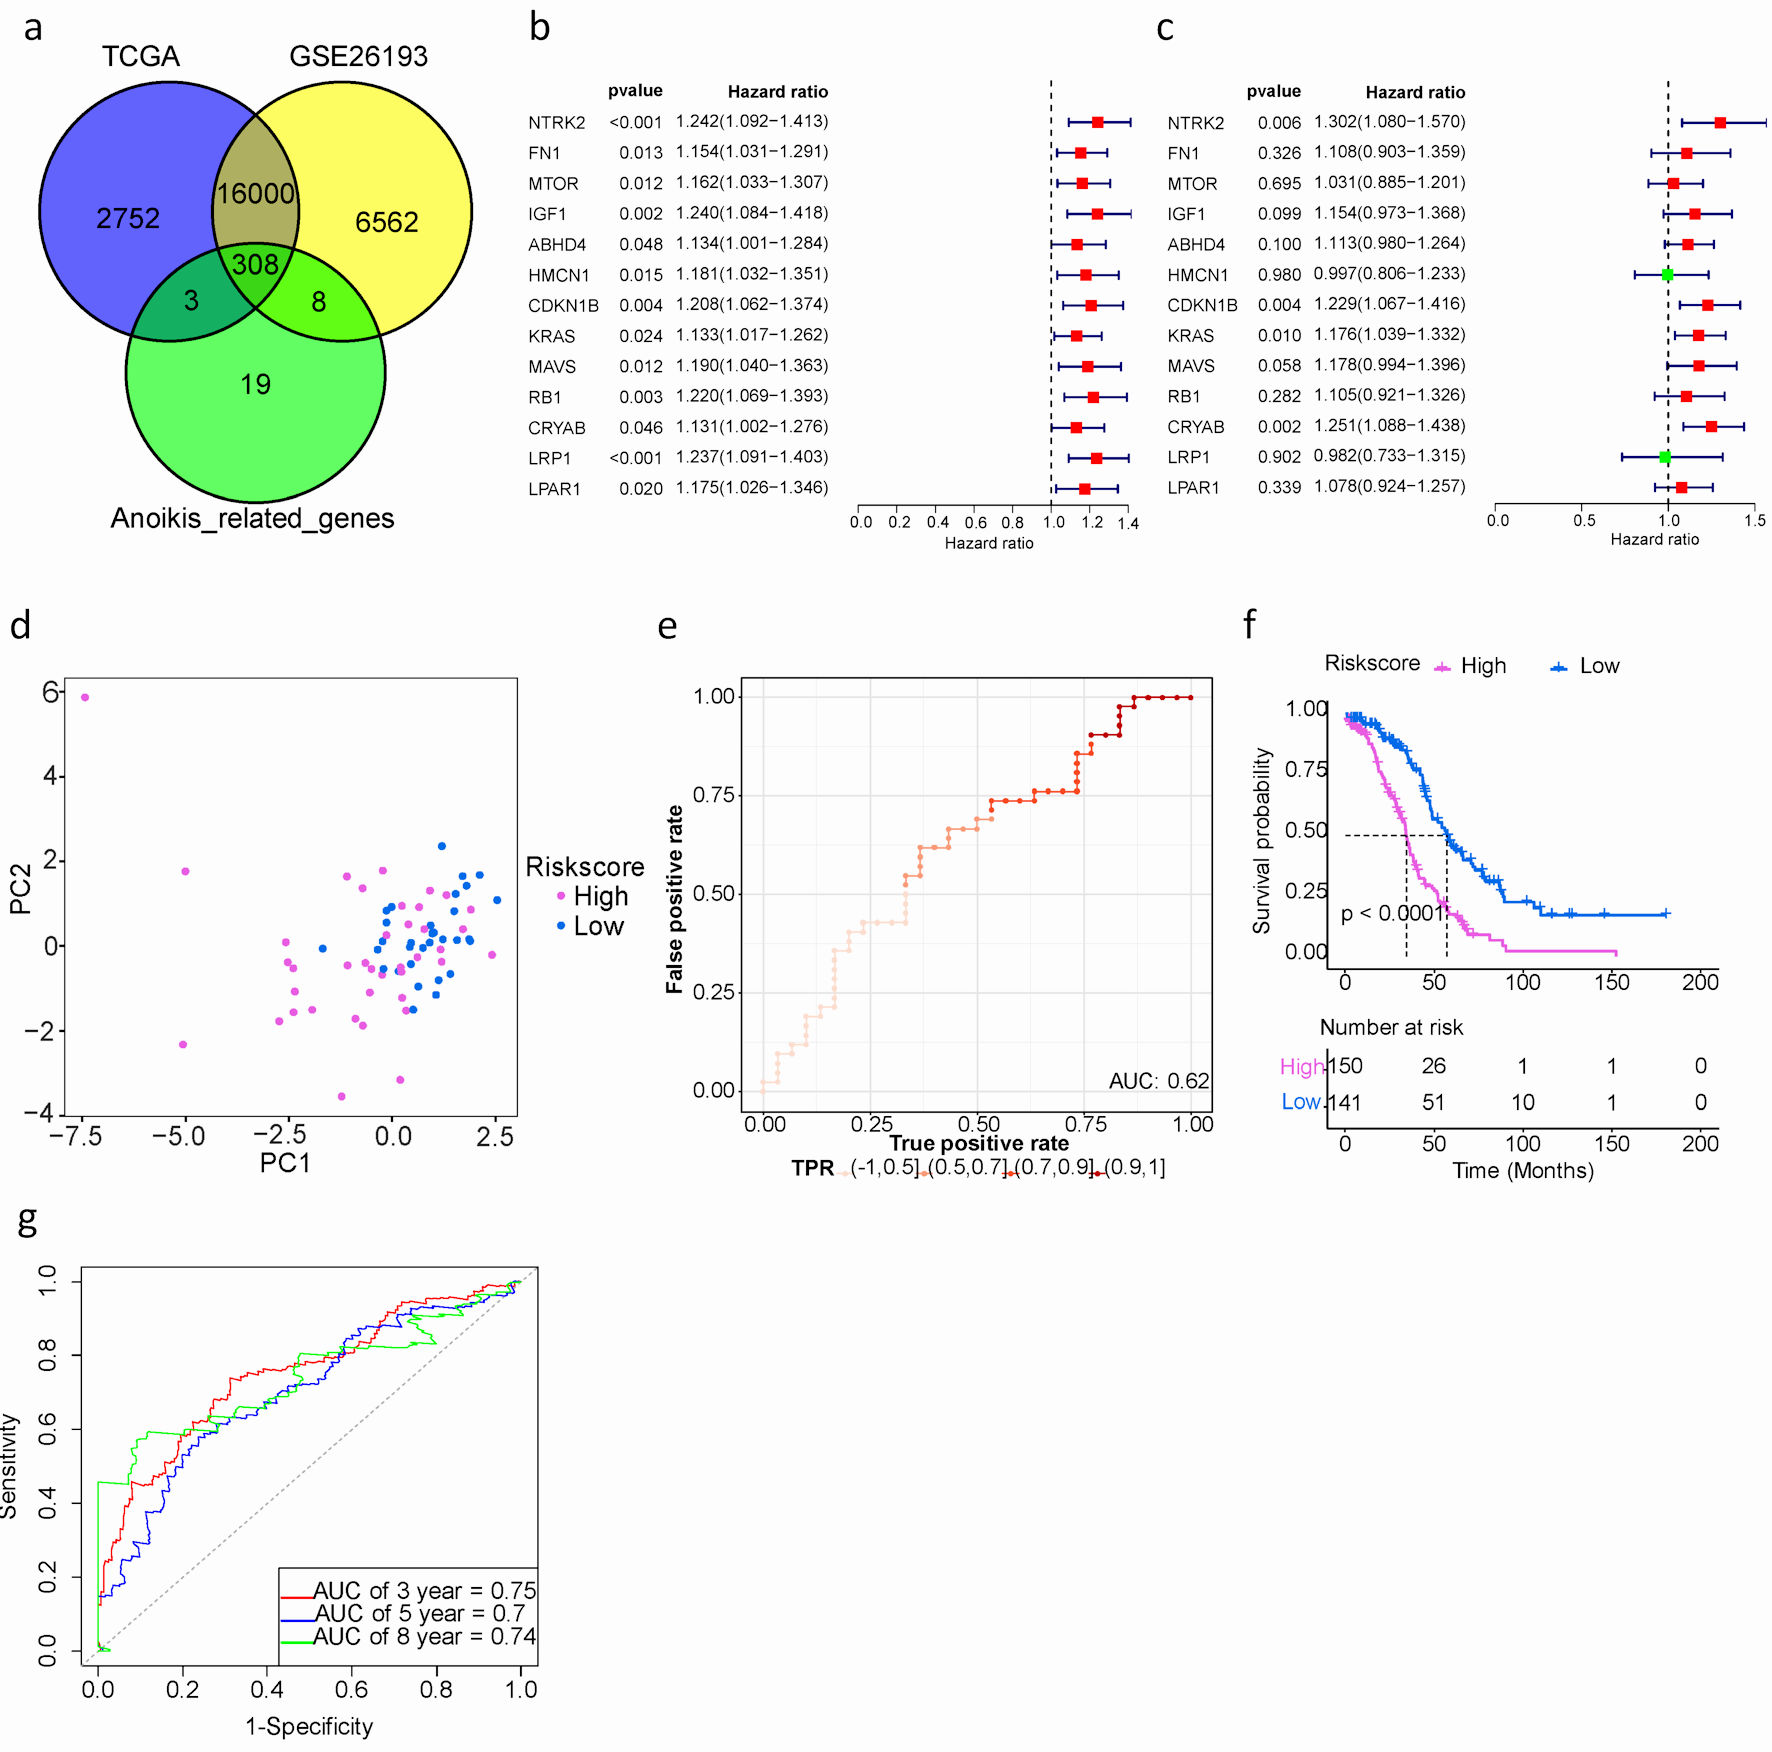 Click for large image | Figure 2. Development and assessment of a prognostic signature comprising ARGs in the TCGA cohort for SOC patients. (a) Venn plot of ARGs among TCGA, GEO and GeneCards databases. (b) Univariate Cox proportional hazard regression analysis for ARGs. (c) Multivariate Cox proportional hazard regression analysis for ARGs. Hazard ratio (HR) greater than 1 is marked red, HR less than 1 is marked green. (d) The distribution of gene expression in high- and low-risk groups in TCGA testing cohort. (e) Evaluation of the performance of ARGs signature model in TCGA testing cohort. (f) Kaplan-Meier curves of the prognostic predictors for high-risk and low-risk with SOC patients. Purple represents the high-risk group, blue represents the low-risk group, and the black dashed line represents the median survival time. (g). Time-dependent ROC curves for predicting the 3-, 5-, 8-year survival in TCGA cohort. SOC: serous ovarian cancer; ARGs: anoikis-related genes; TIME: tumor immune microenvironment; GEO: Gene Expression Omnibus; TCGA: The Cancer Genome Atlas; ROC: receiver operating characteristic. |
Additionally, patients were classified into high- or low-risk groups using the optimal cut-off value (0.858) of the risk score. Particularly, the high-risk group exhibited a significantly worse prognosis compared to the low-risk group, as revealed by Kaplan-Meier survival analysis (median overall survival (mOS): 34.2 vs. 57.1 months, hazard ratio (HR): 2.590, 95% confidence interval (CI): 0.159 - 6.00, P < 0.001) (Fig. 2f). The AUCs for predicting OS at 3, 5, and 8 years were 0.75, 0.7, and 0.74, respectively. (Fig. 2g).
Taken together, the 13 ARGs risk prediction model could effectively stratify SOC patients.
Validation of the SOC prognostic model in TCGA and GEO datasets
In order to evaluate the prognostic performance of the anoikis-related risk signature model constructed in the training cohort, additional internal and external validation datasets were used. The same cut-off value (0.858) was applied to classify patients in both the TCGA testing cohort and the GSE26193 validation cohort. Firstly, PCA results demonstrated a clear distinction between high- and low-risk groups in both the TCGA testing cohort and GSE26193 (Fig. 2d, 3a).
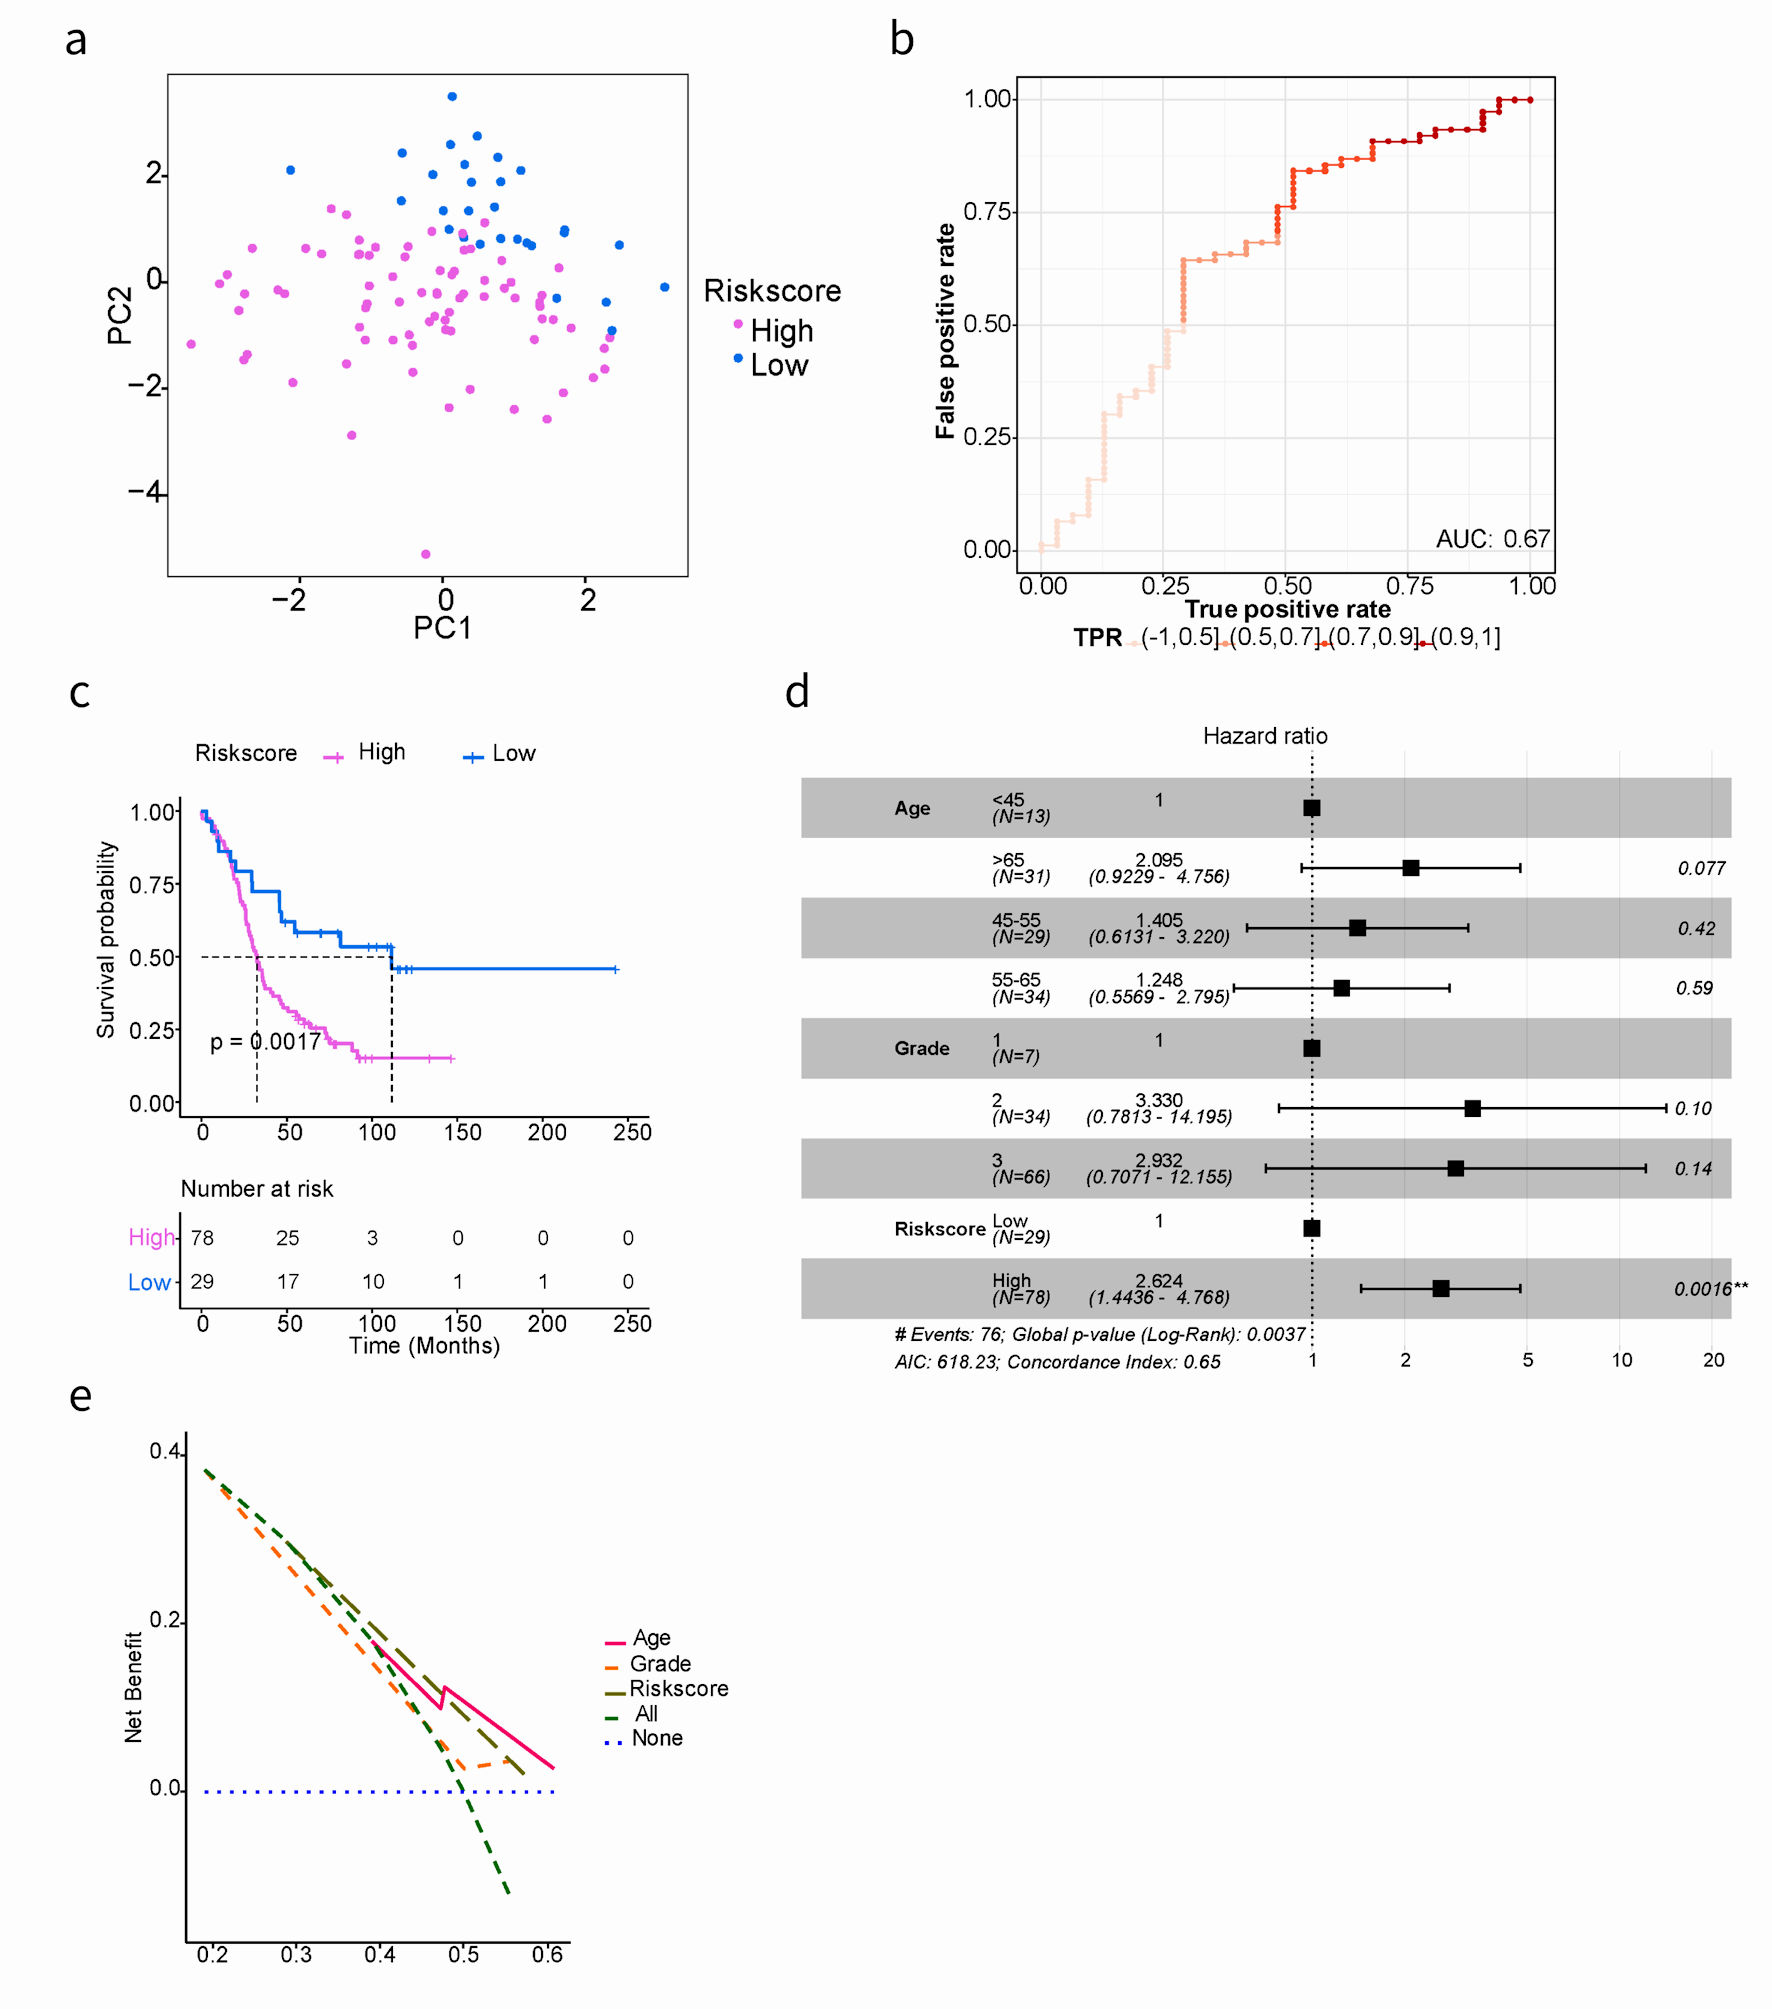 Click for large image | Figure 3. Kaplan-Meier and AUC curves for the prognostic risk signature in validation cohort. (a) PCA showed the characteristic distribution of high- and low-risk groups. Purple represents the high-risk group and blue represents the low-risk group. (b) Evaluation of the performance of ARGs signature model. The AUC ranges from 0 to 1, and the larger the AUC value, the better the model. (c) Kaplan-Meier curves of the prognostic predictors for high-risk and low-risk with SOC patients in GSE26193. (d) Multivariate Cox regression analysis evaluated the prognostic value of the ARGs signature and other clinical factors in the GSE26193 dataset. (e) Calculate and plot decision curve for SOC prognosis. PCA: principal component analysis; AUC: area under the curve; SOC: serous ovarian cancer; ARGs: anoikis-related genes. |
Secondly, model evaluation was performed in 72 samples of the TCGA testing cohort, yielding an AUC of 0.62 (Fig. 2e). Similarly, in the GSE26193 dataset with 107 samples, patients were divided into high- (n = 78) and low-risk (n = 29) groups. The AUC was 0.67, indicating good predictive performance (Fig. 3b). Based on GSE26193 data, survival analysis demonstrated that the high-risk group had a worse prognosis compared to the low-risk group (mOS: 32.5 vs. 111.5 months, HR: 2.504, 95% CI: 0.301 - 3.047, P = 0.002) (Fig. 3c), which was consistent with afore-mentioned findings.
Finally, the performance of the risk signature model was assessed through receiver operating characteristic curve (ROC) curve analysis. In the GSE26193 dataset, the AUCs for predicting OS at 3-, 5-, and 8-year were 0.63, 0.65, and 0.74, respectively (Supplementary Material 7, www.wjon.org). Moreover, independent contribution of the risk score to OS was supported by both multivariate Cox regression analysis and decision curve analysis (Fig. 3d, e), indicating that the prediction model exhibited favorable performance.
Genomic feature analysis
To investigate potential genomic variations, we collected mutation data from whole-exome sequencing. We displayed the waterfall plot of mutated genes (Supplementary Material 8A, www.wjon.org) and identified significantly different mutated genes in risk groups (Supplementary Material 5, www.wjon.org). The frequencies of TP53 and TTN mutations in the high- and low-risk groups were 96% vs. 91%, 43% vs. 34%, respectively. We also analyzed the signaling pathways of mutated genes and found no significant differences between the high- and low-risk groups (Supplementary Material 8B, www.wjon.org).
In addition, Kaplan-Meier survival analysis revealed the predictive value of CSMD3 and SYNE2 mutations in SOC patients, with statistically significant results (Supplementary Material 8C, D, www.wjon.org). Interestingly, the mutation frequency of SYNE2 was not significantly different between risk groups (10% vs. 5%, P = 0.296), while the mutation frequency of CSMD3 was significantly different (19% vs. 6%, P = 0.011). This may indicate that mutations in the CSMD3 gene in high-risk populations are associated with poorer survival.
Comprehensive analysis of differential gene expression and biological pathways in different risk groups
To examine the association of 13 ARGs expression, we conducted a correlation test in R and visualized the results in Figure 4a, focusing on correlations with an absolute value of correlation coefficient exceeding 0.15. We observed a positive correlation among NTRK2, FN1, MTOR, IGF1, HMCN1, KRAS, MAVS, RB1, LRP1, and LPAR1. The Wilcoxon test, a statistical method, was utilized to identify differentially expressed genes (DEGs) between different risk groups. P value < 0.05 and |log2 fold change (logFC)| > 1.5 were regarded as the cut-off criterion based on the TCGA cohort. Totally, 750 DEGs were identified, including 310 downregulated genes 440 upregulated genes. These results were visualized by a volcano plot (Fig. 4b).
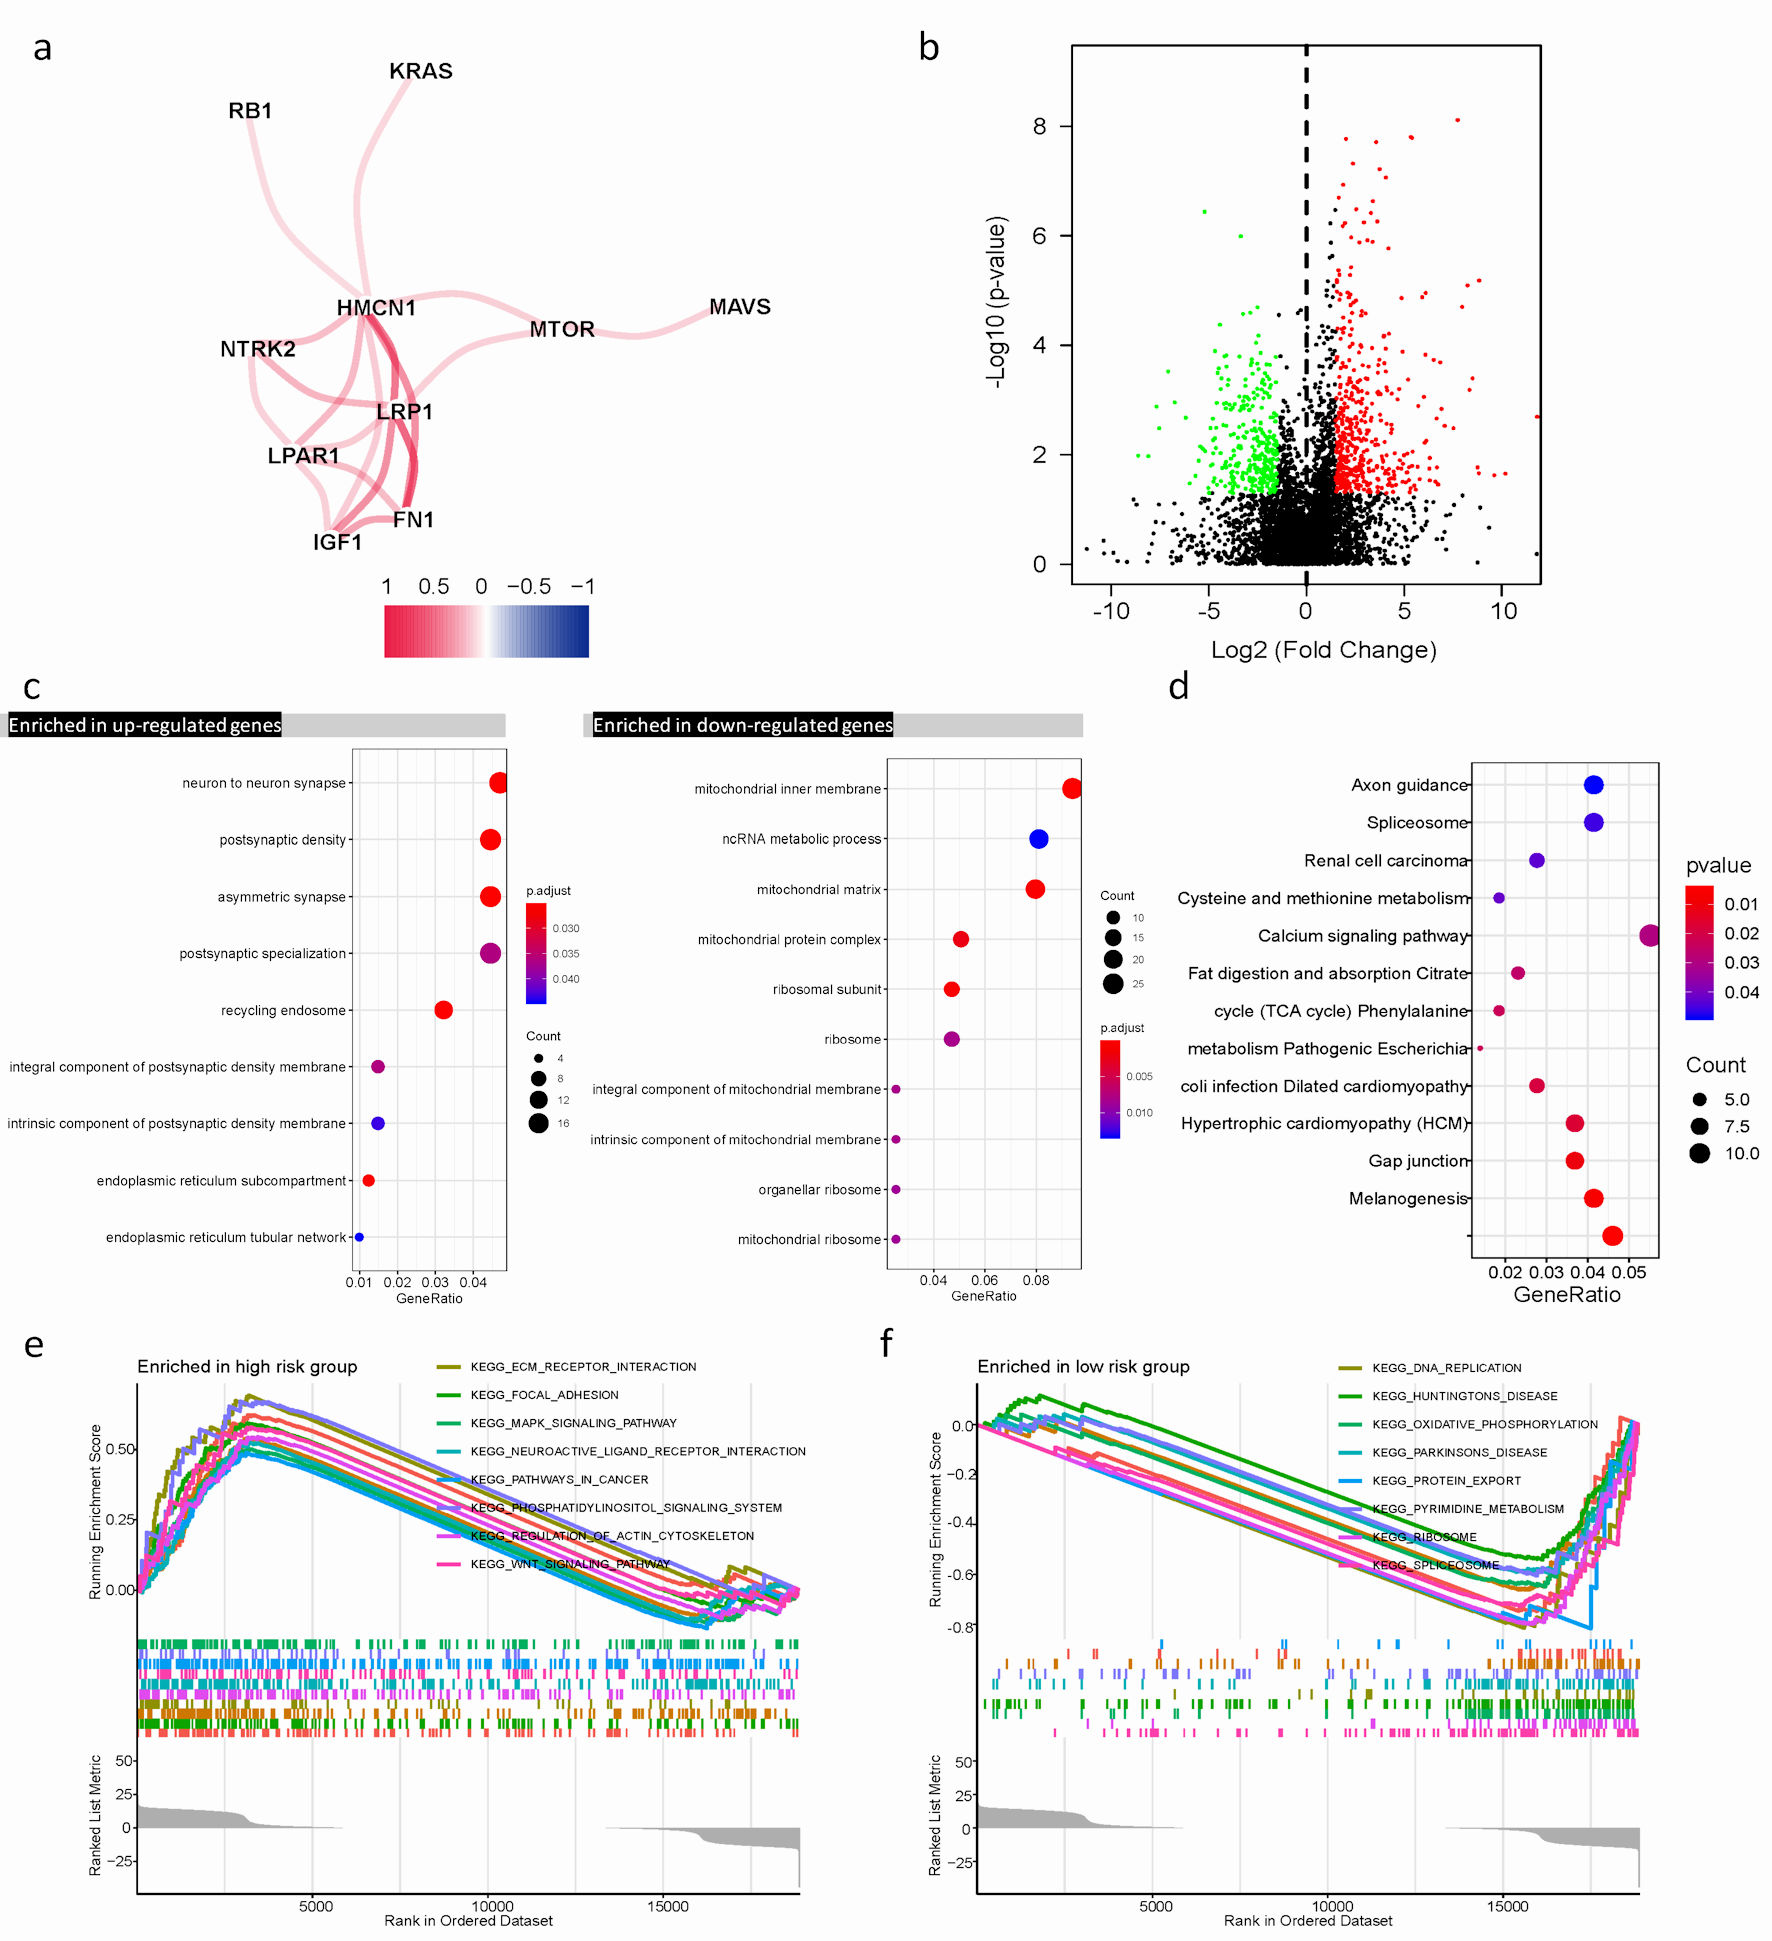 Click for large image | Figure 4. Differential expression of ARGs signature and enrichment of function and pathways in TCGA cohort. (a) The correlation mapping of 13 ARGs. Red represents positive correlation, and blue represents negative correlation. (b) In the volcano plot, red dots represent upregulated DEGs in different risk groups, green dots represent downregulated DEGs, and black dots represent these genes which are not differentially expressed. (c) The dot plot displays these significant terms of BP, CC, and MF based on significant upregulation and downregulation of genes. (d) The significant terms of KEGG pathways. (e, f) The top eight significant GSEA analysis results between the high- and low-risk groups. ARGs: anoikis-related genes; BP: biological process; CC: cellular component; MF: molecular function; KEGG: Kyoto Encyclopedia of Genes and Genomes; GSEA: gene set enrichment analysis; TCGA: The Cancer Genome Atlas; DEGs: differentially expressed genes. |
Functional enrichments of DEGs revealed their involvement in various biological process (BP), cellular component (CC), and molecular function (MF), such as non-coding RNA (ncRNA) metabolic process, mitochondrial inner membrane, neuron to neuron synapse, and asymmetric synapse (Fig. 4c). Furthermore, Kyoto Encyclopedia of Genes and Genomes (KEGG) enrichment analysis indicated these genes were mainly involved in calcium signaling pathway, spliceosome, and melanogenesis. These pathways play crucial roles in regulating cellular processes (Fig. 4d).
GSEA was performed to further explore biological explanations for DEGs. The results demonstrated that genes in the low-risk group were closely associated with DNA replication, and spliceosome. Whereas, in the high-risk group, several tumor progression pathways including MAPK signaling, Wnt signaling, as well as focal adhesion showed enrichment of genes (Fig. 4e, f).
Characteristics of the TIME in different risk groups
Understanding the role of the immune microenvironment in tumorigenesis and immunotherapy response is crucial. Hence, we conducted an in-depth analysis of the TIME landscape of SOC patients in high- and low-risk groups. The relative abundance of 22 types of infiltrating immune cells was shown in Figure 5a. The abundances of T cells gamma delta, M0 macrophages, eosinophils and neutrophils quantified by using CIBERSORT in R platform were significantly different. A noteworthy connection was observed between risk score and prevalence of immune cell infiltration among SOC patients. The high-risk group was more abundant, such as eosinophils (R = 0.25, P = 0.038) and neutrophils (R = 0.32, P = 0.0058) (Fig. 5b, c). In our result, survival analysis unveiled SOC patients with high immune-infiltrating eosinophils or high immune-infiltrating neutrophils, grouped based on the median immune infiltration abundance as the cutoff, had a worse prognosis (Fig. 5d, e). This suggested that the functions of eosinophils and neutrophils in the tumor microenvironment were intricate. Elevated levels of these cells may also serve as indicators of the inflammatory status within the tumor microenvironment. The higher the level of inflammation, the more susceptible tumor cells were to evading immune surveillance and treatment, leading to a worse prognosis.
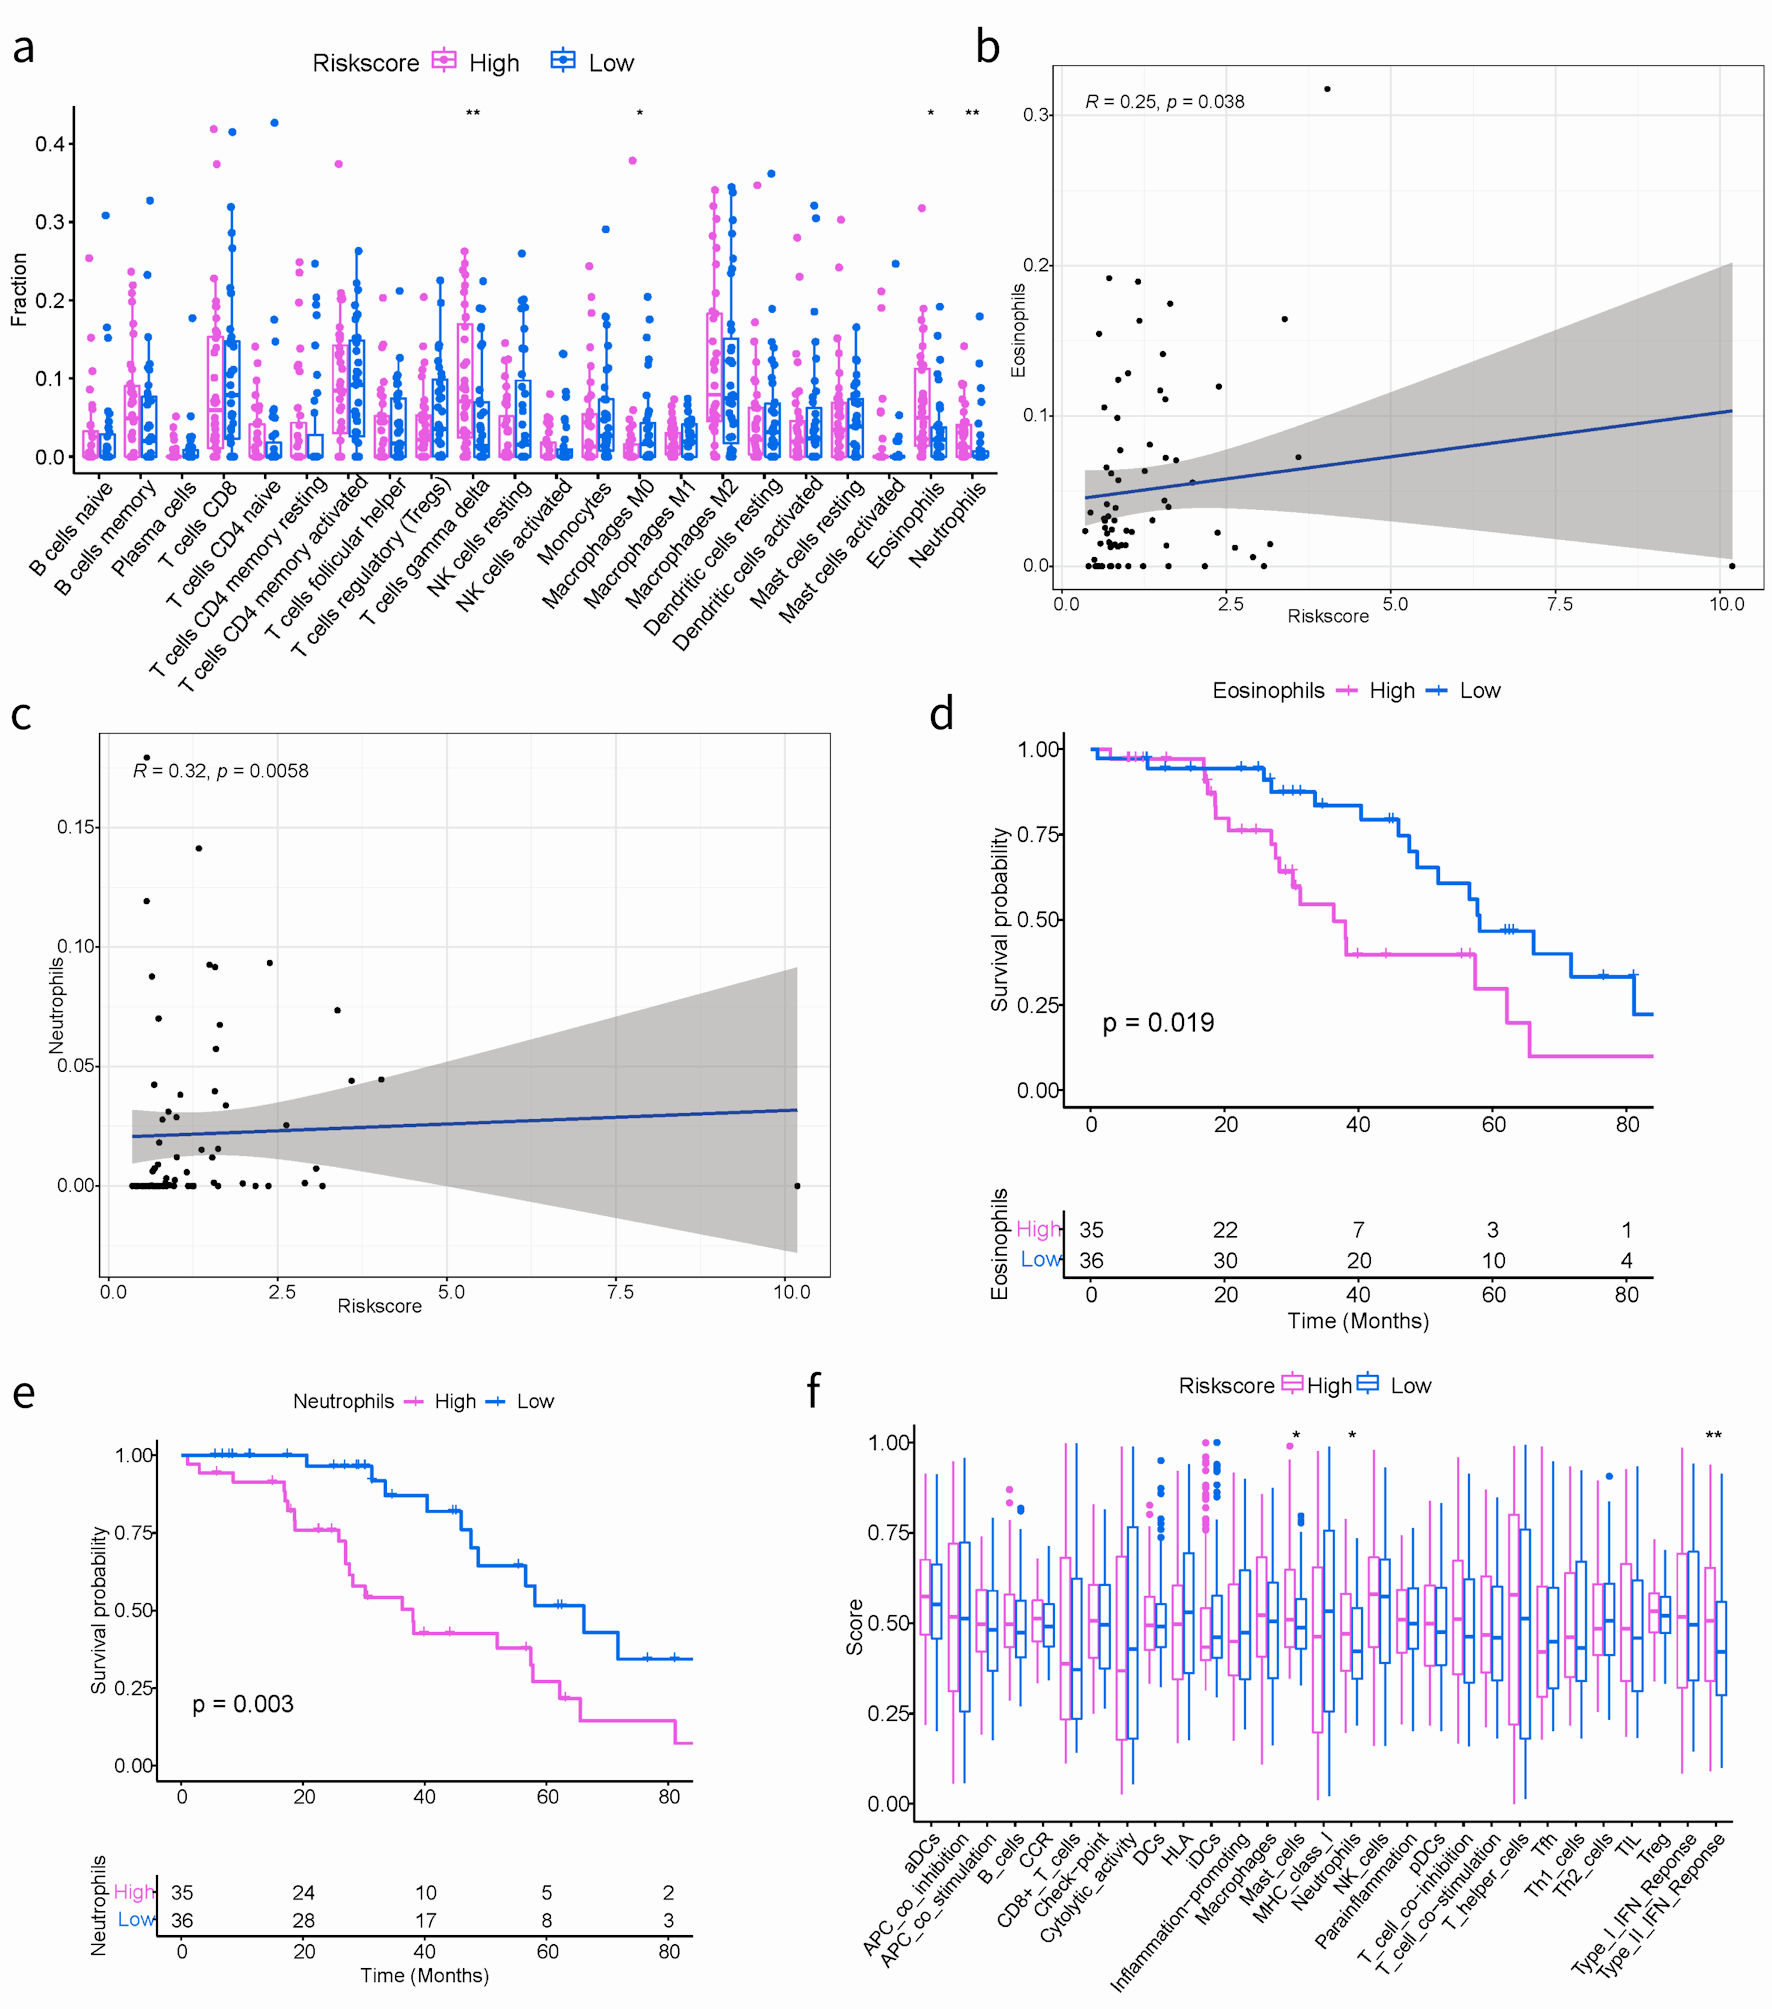 Click for large image | Figure 5. The correlation between the ARGs signature and TIME in TCGA cohort. (a) Boxplots depicting the CIBERSORT scores of 22 immune cells of the high-risk patients compared to low-risk patients. (Wilcoxon test, *P < 0.05, **P < 0.01, ***P < 0.001). (b, c) The correlation plots showing the relationship between the eosinophils/neutrophils cells ratio and ARGs signature in TCGA cohort. (d, e) Kaplan-Meier survival curves of eosinophils/neutrophils cells groups. (f) Comparison of the immune infiltration signature between the different risk groups. ARGs: anoikis-related genes; TIME: tumor immune microenvironment; TCGA: The Cancer Genome Atlas. |
Additionally, the GSVA algorithm was used to evaluate the immune infiltration characteristics. As shown in Figure 5f, notable variances were obtained in the abundance of three distinct immune-related cell types, including mast cells, neutrophils, and the type II interferon (IFN) response. It is worth mentioning that the activation of mast cells, neutrophils, and type II IFN responses were specifically identified within the high-risk group.
Correlation of ARGs signature risk score with drug sensitivity
To predict drug sensitivity of ARGs signature, we acquired the expression data and the corresponding drug sensitivity data from the GDSC and CellMiner databases. Based on the expression levels of the 13 genes-constructed ARGs risk model and the half maximal inhibitory concentration (IC50), the correlation coefficient was calculated. The IC50 is the most extensively utilized and informative indicator of a drug’s efficacy [16]. |Pearson correlation coefficient| ≥ 0.4 and P < 0.001 were included in this study. The higher the expression level of ARGs, the greater the IC50 value and the more significant the drug resistance (Supplementary Material 9A, www.wjon.org). When the correlation coefficient was less than -0.4, there was a decrease in the IC50 value with an increase in the expression of the specific gene, indicating that patients with high expression of these specific genes were more sensitive to the drug.
By using “pRRophetic” R package, we investigated the differences in sensitivity to clinical drugs and revealed the significant correlation between IC50 values of nine drugs and risk groups. These results might highlight the varying sensitivities of different groups to specific drugs (Supplementary Material 9B, www.wjon.org). The IC50 value of metformin was observed to be higher in the high-risk group in contrast to the low-risk group, indicating that the low-risk group benefited more from metformin (Supplementary Material 9C, www.wjon.org). Ponatinib (AP.24534) is a potent inhibitor of various tyrosine kinases and is currently authorized by the US Food and Drug Administration for managing chronic myeloid leukemia [17]. Our findings focus on the negative correlation between risk score and IC50, perhaps implying that patients in the high-risk group were more sensitive to ponatinib (Supplementary Material 9D, www.wjon.org).
Expression of ARGs and qPCR validation
To determine whether the ARGs model is universally applicable and robust, we conducted external experimental validation on 12 SOC patients. The expression levels of 13 ARGs were assessed using qPCR experiments, and patients were stratified into high-risk (n = 7) and low-risk (n = 5) groups using the same formula and cut-off values. Consistent with the findings from the TCGA training dataset, the high-risk group demonstrated a worse OS than the low-risk group (Fig. 6a).
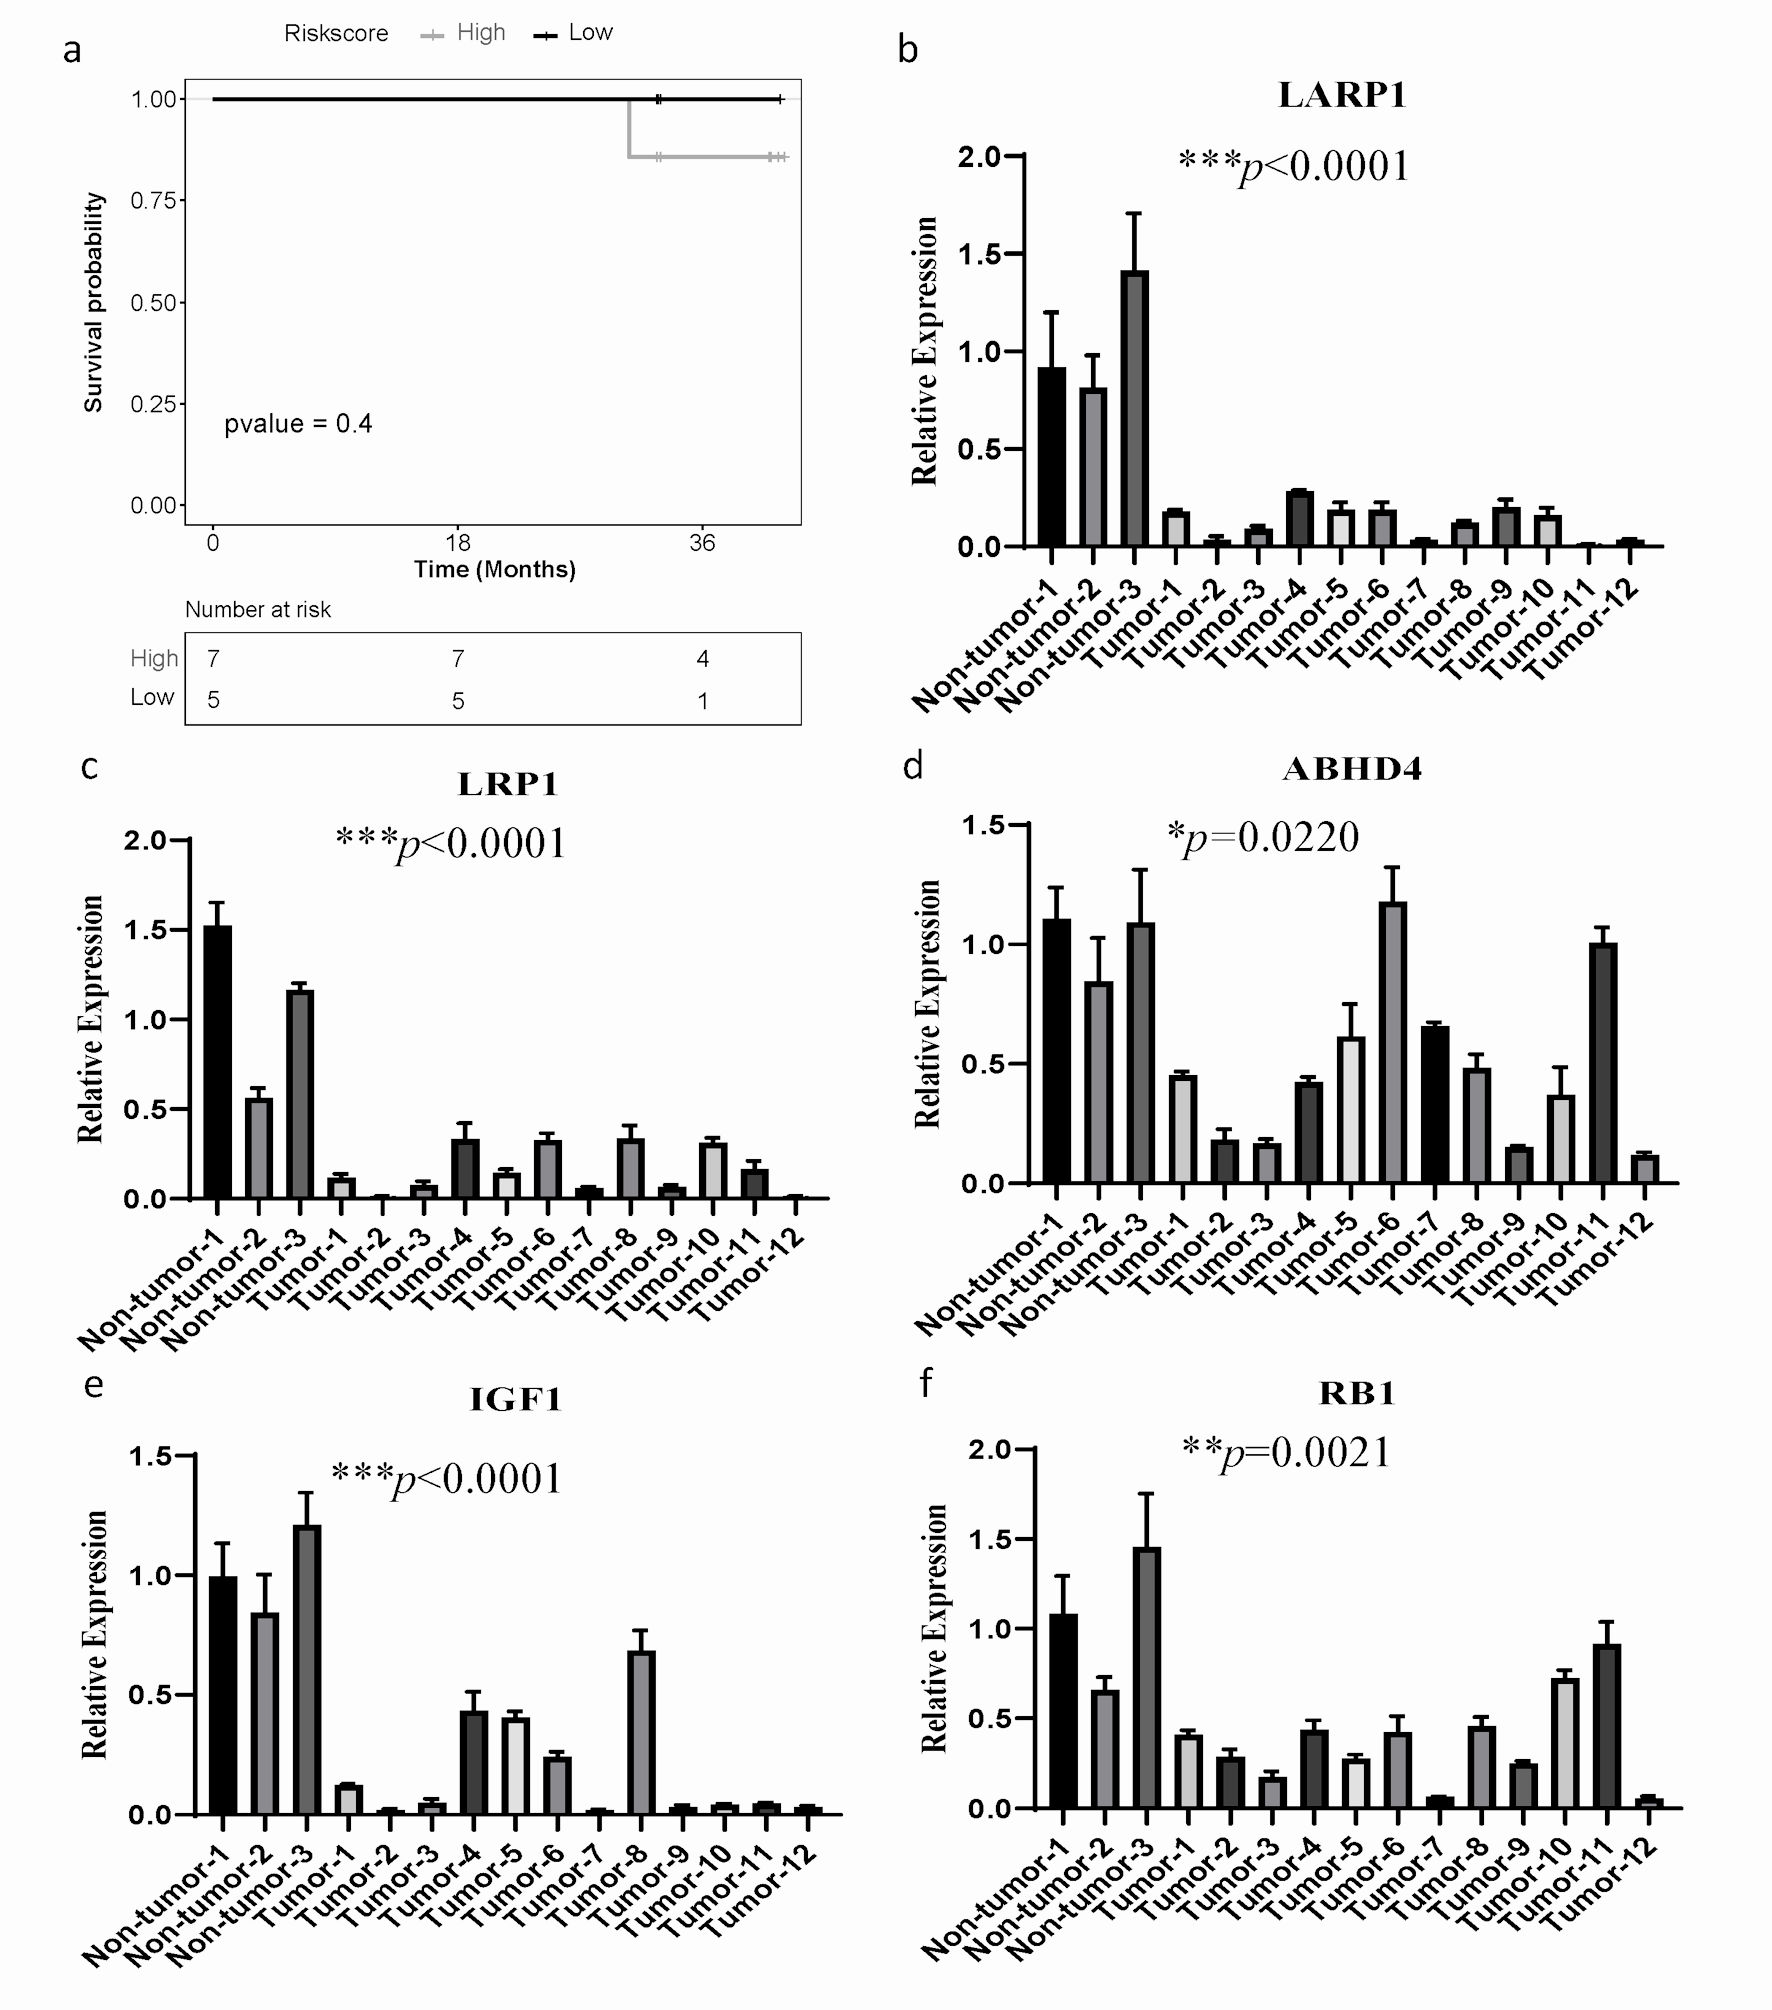 Click for large image | Figure 6. The mRNA expression of ARGs and qPCR validation. (a) Kaplan-Meier curves to compare OS of high-risk and low-risk groups based on the qPCR results in SOC patients. (b-f) The significantly differential mRNA expression of ARGs were presented. GAPDH was used as the internal reference. The error line represents the mean ± standard deviation (SD). SOC: serous ovarian cancer; ARGs: anoikis-related genes; OS: overall survival; qPCR: quantitative real-time polymerase chain reaction; GAPDH: glyceraldehyde 3-phosphate dehydrogenase. |
Furthermore, we investigated the mRNA expression level of 13 genes in 12 ovarian cancer patients and three gynecological benign patients by qPCR assay. Compared to the normal tissue samples, LARP1, LRP1, ABHD4, IGF1 and RB1 were significantly downregulated (Fig. 6b-f), while mRNA levels of other ARGs had no significant difference (Supplementary Material 10, www.wjon.org). These results suggest that LARP1, LRP1, ABHD4, IGF1, and RB1 may have more significant clinical implications in patients with SOC.
| Discussion | ▴Top |
Ovarian cancer is a devastating gynecological cancer that has a low 5-year survival rate of less than 30% [18, 19]. The most prevalent histological subtype of ovarian cancer is SOC. Since classic prognostic indicators, including pathological features (such as cancer antigen 125 (CA125)), serum markers, as well as traditional imaging indicators, have limitations when meeting the challenges in precision medical care [20]. Anoikis is recognized as a hallmark of cancer [21]. It has been the subject of recent studies in various malignant tumors. Recent research found the regulation of mitochondrial activity can lead to ovarian cancer spheroids becoming resistant to anoikis. This finding suggests that targeting anoikis resistance may be a promising approach for treating peritoneal metastasis in SOC [22]. However, there is a lack of research examining the potential predictive significance of anoikis in SOC patients by using bioinformatics techniques.
In the present study, we developed and validated an anoikis-related risk model for prognostic prediction in SOC patients, relying on a 13-gene signature (NTRK2, FN1, MTOR, IGF1, ABHD4, HMCN1, CDKN1B, KRAS, MAVS, RB1, CRYAB, LRP1, LPAR1). Although we executed an independent external validation on the GSE26193, we also performed a qPCR assay to detect the expression of those 13 genes from ARGs risk prediction model. Based on qPCR results, patients were stratified with the same criteria, and the high-risk group had a worse OS compared to the low-risk group. These findings agreed with the bioinformatics analysis described previously. Furthermore, we detected that LARP1, LRP1, ABHD4, IGF1 and RB1 were significantly downregulated in SOC compared with normal ovary. Indicating that those ARGs could be used as independent factors for evaluating SOC prognosis, especially LARP1, LRP1, ABHD4, IGF1, and RB1. A previous study showed that LARP1 modulates BCL2 and BIK to resist apoptosis, promoting ovarian cancer progression and chemotherapy resistance [23]. Pallero et al [24] discovered an alternative function for TSP1 signaling, which is facilitated by the calreticulin/LRP1 co-complex. This finding has implications for the regulation of tissue remodeling and fibrotic reactions, as it contributes to the enhancement of resilience against anoikis [24]. ABHD4, a lipase, regulates tumor cell anoikis resistance. Suppression of ABHD4 in RWPE-1 cells, NP69 nasopharyngeal and OVCAR3 cells were susceptible to anoikis, while upregulation of the gene enhanced sensitivity [25]. Extensive research has shown that IGF1 plays a crucial role in the emergence of resistance against anoikis-induced apoptosis in breast cancer cells responsive to estrogen. It was achieved by activating the PI3-kinase/Akt pathway [26]. Nanao-Hamai et al [27] discovered that Rb1 effectively suppressed apoptosis, a regulatory mechanism involved in the calcification of vascular smooth muscle cells. Additionally, they observed that Rb1 activated Gas6 via the androgen receptor, exhibiting antagonistic effects in prostate cancer [27]. However, research on these genes in SOC is relatively limited, and the underlying mechanism also needs further study to be elucidated.
For further insight into the underlying characteristics of the ARGs risk model, we explored the correlation between high- and low-risk groups from multiple dimensions such as expression profile, mutation landscape, GO, signaling pathways, TIME and drug sensitivity. First of all, we analyzed the mutated landscape and identified significant mutated genes with differential frequencies. Remarkably, the high-risk group exhibited a considerably higher frequency of CSMD3 mutations than the low-risk group. Moreover, our study, along with the findings of Lu et al, demonstrated CSMD3 mutation was significantly correlated with a poor prognosis [28]. Therefore, it is possible to suggest that CSMD3 is a biomarker for SOC prognosis. Furthermore, in the expression profiling analysis, we found alterations in gene functions and the enrichment of signaling pathways among the DEGs. The high-risk group exhibited enrichment in multiple pathways implicated in tumor progression, such as MAPK, Wnt, and focal adhesion signaling pathways. Prior investigations have evidenced the role of MAPK signaling in governing the invasion and migratory potential of SOC cells, whereas Wnt signaling impacts the maintenance of cancer stem cells, metastasis, and immune modulation [29, 30]. These findings may provide insights into the potential reasons for the poorer prognosis observed in high-risk group. Further study of the abnormal regulatory mechanism of these signaling pathways will help to deeply understand the pathogenesis of SOC and provide a theoretical basis for the development of new therapeutic strategies.
In addition, anoikis is closely related to the TIME. Li et al [31] observed a positive correlation between anoikis scores and macrophage levels, as well as para-inflammation, in pancreatic cancer. Conversely, they found a negative correlation between anoikis scores and tumor-infiltrating lymphocytes (TIL) and Th1 levels [31]. According to the report by Xiao et al [32], in cases of colorectal cancer, there was a positive relationship observed between the risk score and regulatory T cells. On the other hand, a negative correlation was found between the risk score and activated dendritic cells, resting memory CD4 T cells, as well as eosinophils [32]. In our research, we observed that risk scores were positively correlated with T cells gamma delta, eosinophils, neutrophils cells, and negatively correlated with M0 macrophages. Besides, we also found that the high-risk group had a higher abundance of eosinophils and neutrophils compared to the low-risk group, which was significantly associated with a poorer prognosis in SOC patients. Overall, these findings suggested that the high levels of eosinophils and neutrophils may predict a poorer tumor prognosis, as they can promote tumor migration and metastasis formation by releasing cytokines. Finally, recent studies have reported that the correlation between anoikis score and sensitivity to chemotherapy drugs in several cancers [33, 34]. Liu et al revealed that a synergistic lethal effect upon co-administration of AZD5153 and palbociclib, resulting in cell cycle arrest and heightened apoptosis, even in cell lines with impaired RB functionality in patients with ovarian cancer [35]. Furthermore, our analysis identified a significant correlation between RB1 expression and palbociclib sensitivity within the context of our 13-gene ARG risk prediction model in SOC. Our data demonstrated contrasting IC50 values for metformin and ponatinib between the high- and low-risk groups. Specifically, the high-risk group exhibited a higher IC50 value for metformin and a lower IC50 value for ponatinib, perhaps indicating that patients in the risk groups have differential efficacy of chemotherapy drugs.
Although the model’s performance was evaluated through testing and independent validation cohorts, as well as in vitro wet experiments, demonstrating its favorable predictive capability, it is important to acknowledge the limitations of our study. First, the wet experiment conducted had a small sample size, resulting in non-statistically significant results, although consistent with previous findings. Therefore, it is essential to expand the sample size and incorporate additional data sources to strengthen reliability. Secondly, this study still lacks clinical information, including patient stage, treatment strategy, efficacy, and other relevant information. In addition, our research needs to further explore the molecular mechanism and biological characteristics to better understand the pathogenesis and prognosis of SOC. In conclusion, our study provides a novel effective prediction model for the prognosis prediction of ovarian cancer, which has important clinical application value. We suggest that with the continuous advancement of technology and the expand accumulation of data, the predictive ability of the risk model will be further improved.
Conclusions
In conclusion, our study developed and validated a robust13-gene signature related with anoikis, which could predict OS in SOC patients. Additionally, we systematically generated and assessed the relationship between the risk score of ARGs’ model and various patterns, including the TIME and drug sensitivity. We suggest that this prognostic model has the potential to benefit SOC patients and contribute to the development of more personalized and precise therapeutic strategies.
| Supplementary Material | ▴Top |
Suppl 1. The gene lists of anoikis.
Suppl 2. The gene lists of signaling pathways.
Suppl 3. The sequences of primers.
Suppl 4. Univariate Cox regression analyses for risk score of patients with SOC.
Suppl 5. The differential percentage of mutated genes.
Suppl 6. LASSO cox regression in the TCGA training cohort. (A) LASSO coefficient of ARGs signature model. (B) Partial likelihood deviance with corresponding log(λ) values at the minimal deviance of the model.
Suppl 7. Time-dependent ROC curves for predicting the 3-, 5-, 8-year survival with risk score in GSE26193 dataset.
Suppl 8. Mutation profiling of ARGs signature and enrichment of pathways. (A) The waterfall plot of gene mutations in high- and low-risk groups. The different colors of the legend on the right represent different variant classifications. Purple represents the high-risk group and blue represents the low-risk group. (B) The frequency of pathways with different groups. (C, D) Kaplan-Meier curves of the significant mutation genes for high-risk and low-risk with SOC patients.
Suppl 9. Efficacy of the ARGs signature in predicting drug sensitivity. (A) Bubble plot of the relationship between drugs and model genes. (B) Correlation analysis of metformin IC50 with risk groups. (C) Boxplots of the comparison of IC50 with drugs between high- and low-risk groups in TCGA cohort. (D) Correlation analysis of AP.24534 IC50 with risk groups.
Suppl 10. The relative mRNA expression of eight ARGs (NTRK2, FN1, MTOR, HMCN1, CDKN1B, KRAS, MAVS and CRYAB) in tumor tissue samples and normal ovarian tissue samples.
Acknowledgments
None to declare.
Financial Disclosure
This work was supported by The China Postdoctoral Science Foundation (2022M711125), National Natural Science Foundation of China (82170192), Hunan Provincial Natural Science Foundation of China (2021JJ40322, 2023JJ30370), The Science and Technology Innovation Program of Hunan Province (2020SK51102, 2021SK51110, 2021SK53713, 2020RC2066) and Scientific Research Project of Hunan Provincial Health Commission (20201401).
Conflict of Interest
The authors declare no potential conflict of interest.
Informed Consent
Informed consent was obtained from all patients involved in the study for the publication of the manuscript.
Author Contributions
Ying Hua Li and Lei Lei Lu designed the study. Hong Yu Deng and Li Wen Zhang analyzed and interpreted the data. Hong Yu Deng and Li Wen Zhang wrote this manuscript. Hong Yu Deng, Ying Hua Li, Li Wen Zhang, Lei Lei Lu and others conducted the experiments and edited and revised the manuscript. All authors have reviewed and approved the final version of the manuscript.
Data Availability
The data of this study are available from the corresponding author upon reasonable request.
Abbreviations
SOC: serous ovarian cancer; ARGs: anoikis-related genes; TIME: tumor immune microenvironment; GEO: Gene Expression Omnibus; GO: gene ontology; BP: biological process; CC: cellular component; MF: molecular function; KEGG: Kyoto Encyclopedia of Genes and Genomes; GSEA: gene set enrichment analysis; ssGSEA: single sample gene set enrichment analysis; TCGA: The Cancer Genome Atlas; PCA: principal component analysis; AUC: the area under the curve; DEGs: differentially expressed genes; OS: overall survival; ROC: receiver operating characteristic; GDSC: the Genomics of Drug Sensitivity in Cancer database; IC50: half maximal inhibitory concentration
| References | ▴Top |
- Coughlan AY, Testa G. Exploiting epigenetic dependencies in ovarian cancer therapy. Int J Cancer. 2021;149(10):1732-1743.
doi pubmed pmc - Oikonomopoulou K, Li L, Zheng Y, Simon I, Wolfert RL, Valik D, Nekulova M, et al. Prediction of ovarian cancer prognosis and response to chemotherapy by a serum-based multiparametric biomarker panel. Br J Cancer. 2008;99(7):1103-1113.
doi pubmed pmc - Frisch SM, Francis H. Disruption of epithelial cell-matrix interactions induces apoptosis. J Cell Biol. 1994;124(4):619-626.
doi pubmed pmc - Douma S, Van Laar T, Zevenhoven J, Meuwissen R, Van Garderen E, Peeper DS. Suppression of anoikis and induction of metastasis by the neurotrophic receptor TrkB. Nature. 2004;430(7003):1034-1039.
doi pubmed - Guadamillas MC, Cerezo A, Del Pozo MA. Overcoming anoikis—pathways to anchorage-independent growth in cancer. J Cell Sci. 2011;124(Pt 19):3189-3197.
doi pubmed - Sun Z, Zhao Y, Wei Y, Ding X, Tan C, Wang C. Identification and validation of an anoikis-associated gene signature to predict clinical character, stemness, IDH mutation, and immune filtration in glioblastoma. Front Immunol. 2022;13:939523.
doi pubmed pmc - Guizhen Z, Weiwei Z, Yun W, Guangying C, Yize Z, Zujiang Y. An anoikis-based signature for predicting prognosis in hepatocellular carcinoma with machine learning. Front Pharmacol. 2022;13:1096472.
doi pubmed pmc - Zhou Y, Hu Z. Anoikis-related genes combined with single cell sequencing: Insights into model specification of lung adenocarcinoma and applicability for prognosis and therapy. Front Cell Dev Biol. 2023;11:1125782.
doi pubmed pmc - Dong Y, Xu C, Su G, Li Y, Yan B, Liu Y, Yin T, et al. Clinical value of anoikis-related genes and molecular subtypes identification in bladder urothelial carcinoma and in vitro validation. Front Immunol. 2023;14:1122570.
doi pubmed pmc - Bai J, Pu X, Zhang Y, Dai E. Renal tubular gen e biomarkers identification based on immune infiltrates in focal segmental glomerulosclerosis. Ren Fail. 2022;44(1):966-986.
doi pubmed pmc - Tibshirani R. The lasso method for variable selection in the Cox model. Stat Med. 1997;16(4):385-395.
doi pubmed - Yan Z, He M, He L, Wei L, Zhang Y. Identification and validation of a novel six-gene expression signature for predicting hepatocellular carcinoma prognosis. Front Immunol. 2021;12:723271.
doi pubmed pmc - Hanzelmann S, Castelo R, Guinney J. GSVA: gene set variation analysis for microarray and RNA-seq data. BMC Bioinformatics. 2013;14:7.
doi pubmed pmc - Geeleher P, Cox N, Huang RS. pRRophetic: an R package for prediction of clinical chemotherapeutic response from tumor gene expression levels. PLoS One. 2014;9(9):e107468.
doi pubmed pmc - Zhang MJ. Cox proportional hazards regression models for survival data in cancer research. Cancer Treat Res. 2002;113:59-70.
doi pubmed - Aykul S, Martinez-Hackert E. Determination of half-maximal inhibitory concentration using biosensor-based protein interaction analysis. Anal Biochem. 2016;508:97-103.
doi pubmed pmc - Tan FH, Putoczki TL, Stylli SS, Luwor RB. Ponatinib: a novel multi-tyrosine kinase inhibitor against human malignancies. Onco Targets Ther. 2019;12:635-645.
doi pubmed pmc - Armstrong DK, Alvarez RD, Bakkum-Gamez JN, Barroilhet L, Behbakht K, Berchuck A, Chen LM, et al. Ovarian Cancer, Version 2.2020, NCCN Clinical Practice Guidelines in Oncology. J Natl Compr Canc Netw. 2021;19(2):191-226.
doi pubmed - Wang W, Jo H, Park S, Kim H, Kim SI, Han Y, Lee J, et al. Integrated analysis of ascites and plasma extracellular vesicles identifies a miRNA-based diagnostic signature in ovarian cancer. Cancer Lett. 2022;542:215735.
doi pubmed - Zhang R, Siu MKY, Ngan HYS, Chan KKL. Molecular biomarkers for the early detection of ovarian cancer. Int J Mol Sci. 2022;23(19):12041.
doi pubmed pmc - Paoli P, Giannoni E, Chiarugi P. Anoikis molecular pathways and its role in cancer progression. Biochim Biophys Acta. 2013;1833(12):3481-3498.
doi pubmed - Gogola-Mruk J, Tworzydlo W, Krawczyk K, Marynowicz W, Ptak A. Visfatin induces ovarian cancer resistance to anoikis by regulating mitochondrial activity. Endocrine. 2023;80(2):448-458.
doi pubmed pmc - Hopkins TG, Mura M, Al-Ashtal HA, Lahr RM, Abd-Latip N, Sweeney K, Lu H, et al. The RNA-binding protein LARP1 is a post-transcriptional regulator of survival and tumorigenesis in ovarian cancer. Nucleic Acids Res. 2016;44(3):1227-1246.
doi pubmed pmc - Pallero MA, Elzie CA, Chen J, Mosher DF, Murphy-Ullrich JE. Thrombospondin 1 binding to calreticulin-LRP1 signals resistance to anoikis. FASEB J. 2008;22(11):3968-3979.
doi pubmed pmc - Simpson CD, Hurren R, Kasimer D, MacLean N, Eberhard Y, Ketela T, Moffat J, et al. A genome wide shRNA screen identifies alpha/beta hydrolase domain containing 4 (ABHD4) as a novel regulator of anoikis resistance. Apoptosis. 2012;17(7):666-678.
doi pubmed - Luey BC, May FE. Insulin-like growth factors are essential to prevent anoikis in oestrogen-responsive breast cancer cells: importance of the type I IGF receptor and PI3-kinase/Akt pathway. Mol Cancer. 2016;15:8.
doi pubmed pmc - Nanao-Hamai M, Son BK, Komuro A, Asari Y, Hashizume T, Takayama KI, Ogawa S, et al. Ginsenoside Rb1 inhibits vascular calcification as a selective androgen receptor modulator. Eur J Pharmacol. 2019;859:172546.
doi pubmed - Lu N, Liu J, Xu M, Liang J, Wang Y, Wu Z, Xing Y, et al. CSMD3 is associated with tumor mutation burden and immune infiltration in ovarian cancer patients. Int J Gen Med. 2021;14:7647-7657.
doi pubmed pmc - Harmych SJ, Kumar J, Bouni ME, Chadee DN. Nicotine inhibits MAPK signaling and spheroid invasion in ovarian cancer cells. Exp Cell Res. 2020;394(1):112167.
doi pubmed pmc - Zhan T, Rindtorff N, Boutros M. Wnt signaling in cancer. Oncogene. 2017;36(11):1461-1473.
doi pubmed pmc - Li N, Jia X, Wang Z, Wang K, Qu Z, Chi D, Sun Z, et al. Characterization of anoikis-based molecular heterogeneity in pancreatic cancer and pancreatic neuroendocrine tumor and its association with tumor immune microenvironment and metabolic remodeling. Front Endocrinol (Lausanne). 2023;14:1153909.
doi pubmed pmc - Xiao Y, Zhou H, Chen Y, Liu L, Wu Q, Li H, Lin P, et al. A novel anoikis-related gene prognostic signature and its correlation with the immune microenvironment in colorectal cancer. Front Genet. 2023;14:1186862.
doi pubmed pmc - Zhao Z, Li W, Zhu L, Xu B, Jiang Y, Ma N, Liu L, et al. Construction and verification of a fibroblast-related prognostic signature model for colon cancer. Front Genet. 2022;13:908957.
doi pubmed pmc - Zhang Z, Zhu Z, Fu J, Liu X, Mi Z, Tao H, Fan H. Anoikis patterns exhibit distinct prognostic and immune landscapes in Osteosarcoma. Int Immunopharmacol. 2023;115:109684.
doi pubmed - Liu C, Huang Y, Qin T, You L, Lu F, Hu D, Xiao R, et al. AZD5153 reverses palbociclib resistance in ovarian cancer by inhibiting cell cycle-related proteins and the MAPK/PI3K-AKT pathway. Cancer Lett. 2022;528:31-44.
doi pubmed
This article is distributed under the terms of the Creative Commons Attribution Non-Commercial 4.0 International License, which permits unrestricted non-commercial use, distribution, and reproduction in any medium, provided the original work is properly cited.
World Journal of Oncology is published by Elmer Press Inc.